Autoinjector simulation for spring force, stopper friction and viscous biologics
A spring that finishes its stroke on water can stall on a viscous formulation, and a stopper that breaks loose on the bench can load the glass at impact. Simulating spring, stopper, barrel and needle together compares the changes before the next prototype build.
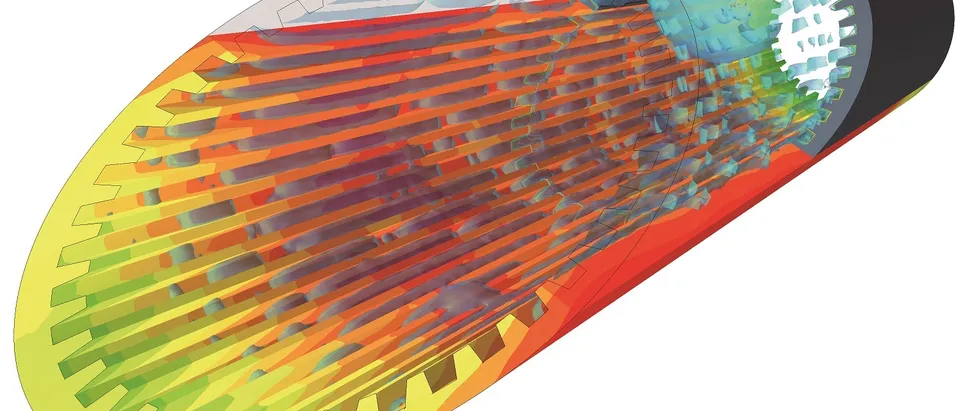
Autoinjector simulation predicts how a drive spring, a stopper and a thin needle behave together: the force the spring delivers, the injection time for your formulation's viscosity, and the stress in the glass barrel when the rod strikes. We build it around your existing solver, so a spring, stopper or needle change is compared before the next prototype build.
The autoinjector fires cleanly on water. Then the dose is fixed at the concentration the formulation needs, and the same spring must push a more viscous liquid through the same thin needle, across the temperature range the device will see. Does the stroke finish inside the injection time on the label? Does the stopper break loose? Does the glass flange survive the rod? Spring tooling and the verification builds wait on those answers, and a late spring change means a tooling loop and a reworked test report.
What does autoinjector simulation have to capture?
Three problems share one stroke. Drive dynamics come first: a compression spring pushes a rod, the rod a stopper that rubs on the barrel, the stopper liquid through the needle. In the Poiseuille limit a moving mass m obeys m dv/dt = k(δ0 − x) − Ff − bv, with spring rate k, initial compression δ0, stroke x, stopper friction Ff and b = 8πμLD4/d4 for viscosity μ, plunger diameter D, needle length L and bore d. The spring force falls as it extends, so the stroke must end with force to spare. Derakhshandeh and co-authors (2026) found that cutting the fill volume of one spring-driven platform by up to half shortened the injection time by up to 40%, while the flow rate fell, because the spring is less compressed during delivery.
- Drive spring. A compression spring stores the energy for the stroke, and its force falls as it extends. The stroke has to end with force to spare once friction and the viscous load are paid; a constant-force or torsional spring changes this curve.
- Air gap and rod flight. The rod accelerates across the air gap before it strikes the stopper. A longer free flight means a faster impact, and for a moment the force on the stopper is far above the steady spring force.
- Stopper friction. The stopper sits in the barrel with an interference fit and a silicone film. The force to start it moving is the break-loose peak, the force to keep it moving is the glide force, and in a filled syringe the liquid adds to it.
- Liquid column. The impact sends a pressure wave through the liquid, and the abrupt acceleration of the syringe can open tension in it, which is how cavitation starts. The air gap sets the timing, so it sets how severe the event gets.
- Flange and cone. The glass sees the event in two places: the flange, where it meets a mechanical stop, and the conical section, where pressure waves can focus. Both are checked against the strength distribution of the glass, not against one number.
- Needle. The thin bore sets most of the pressure drop. It rises with viscosity, with needle length and with the fourth power of the bore, and the step from barrel to needle adds a term that a straight-tube formula leaves out.
- Force margin. The gap between the spring force and the combined friction and viscous load at the end of the stroke. It shrinks as viscosity rises and as temperature falls, so it is checked at the worst corner of the range, not on water.
Second, the impact. An air gap separates rod and stopper, so the rod is moving when it strikes. Veilleux and Shepherd (Drug Delivery and Translational Research, 2018) measured and simulated the result in autoinjectors for viscous solutions: peak pressures and stresses from impacts, accelerations and tension waves that cause cavitation, with an intensity that depends on the timing between pressurisation and syringe acceleration, which the air gap sets, and shock waves that can focus in the conical section. In push-button designs the syringe also meets a mechanical stop, so the flange region is a critical area for the glass. Coupling liquid pressure to the barrel is a fluid-structure interaction problem.
Third, the flow. Hagen-Poiseuille gives Δp = 128μLQ/(πd4): linear in viscosity and length, fourth power in bore, so halving the bore multiplies it by sixteen. It is a start. Lanzaro (2021) pushed concentrated albumin solutions, a stand-in for antibody formulations, through a microfluidic contraction with the ratio of 26 G and 27 G needles and measured a pressure drop well above the shear-only contribution: the step from barrel to needle adds an extensional term that injection-force predictions usually omit. Whether a formulation thins with shear is a measurement, not an assumption.
How are spring and injection time usually set, and where does that break?
A common route is to size the spring on the bench: fire units on water, read force and position, change the spring, repeat. Three things go wrong.
- Water is one end of the window. It is the conservative case for dose accuracy and needle dynamics, since low viscosity lets liquid leave before the needle is at depth, and the validated model of Kennelly and co-authors (International Journal of Pharmaceutics, 2024) predicts the largest cavitation bubbles in less viscous solutions. A viscous formulation moves the risk to injection time and end-of-stroke force.
- Doses change late. A platform must take another fill volume; rod flight, impact, rate and time all move, and each check costs a build.
- Component limits float. Boltres and co-authors (2026) note that acceptance criteria are mostly set for the finished product, so limits for barrel, stopper and shield are agreed between supplier and manufacturer on risk. A model linking components to finished-product outputs makes that agreement concrete.
- Stopper and flow rate. The stopper sets the flow rate through its speed and the barrel area. The force it needs is the pressure at the barrel end of the needle times that area, plus friction.
- Barrel-to-needle contraction. Liquid accelerates into the cone and is stretched as the streamlines converge. For concentrated protein solutions this extensional deformation adds pressure drop on top of the shear in the needle, and injection-force formulas often leave it out.
- Needle bore. In fully developed flow the velocity is parabolic and the shear is highest at the wall. The Hagen-Poiseuille pressure drop grows with viscosity and length and with the fourth power of the bore: halve the bore and it multiplies by sixteen.
- Shear-thinning check. A concentrated formulation can thin as the shear rate rises, or not. The viscosity that goes into the model is the one measured at the shear rates the needle produces, not the low shear of a bench rheometer.
- Low-viscosity end. Water is the conservative case for dose accuracy and needle dynamics, and cavitation after impact is more severe in a less viscous liquid. Rod speed and air gap decide how close this end comes to its limit.
- High-viscosity end. Injection time grows and the force margin at the end of the stroke shrinks as viscosity rises. A colder formulation moves right along this axis, so the limit is checked at the cold end of the range.
- The window. The viscosity range in which both limits are met, between the dashed lines. Its width is a result of the model, set by spring, air gap, bore and stopper, so the device and the formulation are tuned together.
How do break-loose force, glass load and the seal get modelled?
The stopper is a nearly incompressible elastomer in an interference fit with a silicone film. We model it as hyperelastic and fit its friction to force-displacement traces from your empty and filled syringes. The first peak is break-loose force, the sustained force is glide force, and in a filled syringe the liquid adds to it as extrusion force. Boltres and co-authors measure these with ISO 11040-4:2024 Annex E and name the silicone specification and the interference fit as the design outputs behind break-loose.
The glass takes the rod impact through the liquid, the flange stop and the needle-shield pull. A finite-element model gives the stress for each case; strength comes from your tests. In the low-fill study, weights dropped on the flange from rising heights gave a failure-energy distribution, fitted with a log-normal law, from which failure probability was read. The margin is the stress distribution against the strength distribution.
The seal is a contact-pressure question: a rib seals while its contact pressure stays above the pressure of the liquid behind it, including the impact spike and as the elastomer relaxes. Boltres and co-authors verify closure integrity by helium leak, the deterministic method, and blue dye, the probabilistic one. The model shows where the ribs go and how much interference to give; the test shows whether the system seals.
| Question | What the model carries | What it reports | Decision it supports |
|---|---|---|---|
| Spring and injection time | Spring rate and preload, friction, viscosity and temperature range, needle bore | Stroke time, force margin at the end | Spring, needle bore, viscosity ceiling |
| Stopper break-loose and glide | Hyperelastic stopper, interference, friction fitted to your traces | First-peak and sustained force | Stopper geometry, interference, silicone specification |
| Impact and glass load | Air gap, rod mass and speed, liquid compressibility, flange stop | Pressure history, flange load, glass stress | Air gap, rod length, flange support |
| Viscous flow through the needle | Shear-dependent viscosity, barrel-to-needle contraction | Pressure drop, wall shear rate | Needle gauge and length, viscosity limit |
| Shield removal and handling | Shield, hub, glass cone, cap | Load path, stress at the cone | Shield grip, cap geometry |
| Wearable or patch pump | Reservoir, drive, cannula, back pressure from your data | Delivery time at the set rate, pressure margin | Drive sizing, cannula bore |
What changes for a patch pump or wearable injector?
The chain stays; the drive changes. ISO 11608-1:2022 covers needle-based injection systems that deliver discrete (bolus) volumes and excludes continuous delivery at a clinically specified rate, such as insulin patch pumps; ISO 11608-6:2022 covers on-body delivery systems for a bolus. We model reservoir, drive and cannula, with injection-site back pressure from your measurements, and report delivery time against the set rate.
How is an autoinjector model validated, and for what use is it credible?
Verification: mesh and time-step convergence, an energy balance, and the Poiseuille pressure drop reproduced in a straight needle. Validation: force and position traces from fired devices on water and on a viscosity-matched fluid, at both ends of the temperature range, against tolerances set before the run. Uncertainty: spring, friction, viscosity, bore and air gap, swept so the answer is a range.
How much is enough depends on the use. ASME V&V 40-2018, Assessing Credibility of Computational Modeling through Verification and Validation: Application to Medical Devices, asks that credibility match how far the model is relied on and the consequence of a wrong decision; the FDA's final guidance of November 2023, Assessing the Credibility of Computational Modeling and Simulation in Medical Device Submissions, gives a risk-informed framework. Our context of use: choose spring preload and rate, needle bore and stopper interference across a stated viscosity and temperature range, and decide which variants enter the verification builds. The model ranks and narrows; tests on built devices stay the evidence. For a combination product, how the guidance applies is for the reviewing office.
A predicted force is not a verified injection
Where does AI help autoinjector design, and where does it not?
- Design-space screening. A designed set of dynamic runs over spring, friction, bore, fill, air gap and viscosity trains a surrogate that returns injection time, force margin and peak acceleration inside its range; the full model runs for the variants that matter. See surrogate models for CFD and FEA.
- Friction calibration. An inverse fit to your break-loose and glide traces returns a range, which enters the uncertainty record.
- Trace checking. A script compares each fired-device trace with the model band and flags a double peak or a stall.
It does not replace formulation or glass-strength data, cannot predict outside its range, and never decides acceptability. Nor does it predict protein aggregation or particles: the low-fill study says such findings do not carry across formulations. See AI surrogate models you can sign off.
From one device study to a drug-delivery workflow you keep
The return comes when your engineers can put the next spring, stopper or needle through the same chain without rebuilding anything.
- Physics model. CFD and FEA set up once, as templates: geometry clean-up, mesh, solver settings and post-processing that every later run reuses.
- Validation. Mesh and time-step studies, and comparison with tests or full-scale data, so the model's uncertainty is known before it is trusted.
- Automated runs. Scripted runs over the parameters and operating conditions that matter, on your hardware or in the cloud.
- AI surrogate. A machine-learning model trained on those runs answers in seconds and says how sure it is; low-confidence questions go back to the solver.
- Decision tool. Optimisation, trade-off charts or operating guidance, in a form your engineers and operators use every day.
- Field data. Test, trial and monitoring data flow back to recalibrate the model, so it improves with every project instead of being rebuilt.
- An injector template in your existing solver, holding spring, rod, stopper, barrel, needle and stops, with air gap, fill and bore as parameters.
- A friction calibration script from your break-loose and glide traces, with the fit and its range on record.
- A fluid table of viscosity against shear rate and temperature, from your rheometry.
- A validation record against fired-device traces on water and a viscosity-matched fluid, with tolerances set first.
- A surrogate with a stated range in spring, stopper, needle, fill and viscosity, and a gate that sends anything outside it to the full model.
- Handover and training, so your team runs and extends it. See our training and software development services, and the medical and biomedical devices hub.
Questions engineers ask about autoinjector and syringe simulation
What is break-loose force in a prefilled syringe?
How does viscosity change autoinjector injection time?
Can simulation replace autoinjector testing?
What does ISO 11608 cover?
Does simulation predict protein aggregation or silicone oil particles?
If a spring, stopper or needle is waiting on a force or time number, send us the syringe and needle drawings, the spring rate, free length and preload, the stopper drawing with its silicone specification, the formulation's viscosity against shear rate and temperature, the target injection time, and any force and position trace from a fired device. We reply with how we would build the model, the outputs it would report, and what the validation record should contain. Start with a conversation, or read about our AI/ML consulting for FEA and CFD.