Dental implant simulation for abutment screws, bone loading and jaw fixation plates
A line reaches design freeze with a screw that lost torque in the bench build, a bone-density question and a fixation plate layout, and each usually costs another round of hardware. Simulating the connection, the bone and the plate shows which variants earn the next bench slot.
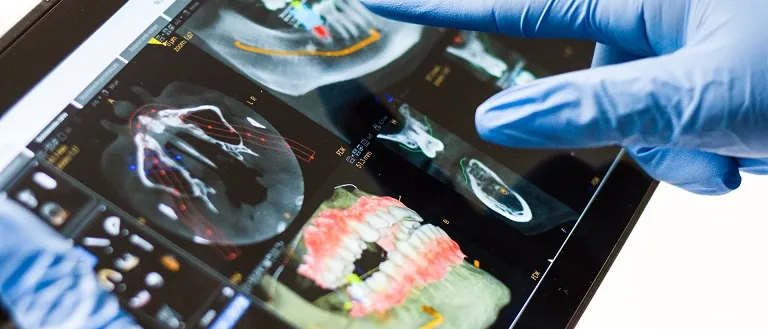
Dental implant simulation predicts how much preload the abutment screw keeps under chewing-type loads, where strain concentrates in the implant and the bone around it, and how far the implant moves in its socket. We build it around your existing solver, so a connection design, a thread form or a bone-density case is ranked on the model before the next fatigue build and prototype lot are committed.
Design freeze for an internal-connection implant line is weeks away. The last fatigue build lost abutment-screw torque early, the next bench slot is booked, and the series needs its worst case named. The application team asks how far the implant moves in low-density bone, and the craniomaxillofacial group asks whether a new fixation plate holds the fragments as stiffly as the old one.
Why does an implant abutment screw loosen, and what can a model show?
An abutment screw is a preloaded joint. Tightening torque T gives preload Fi through T = K Fi d, with d the screw diameter and K a factor carrying thread and head friction. A systematic review (Pardal-Peláez and Montero, 2017) states that only about 10% of the torque becomes preload and the other 90% overcomes friction.
The joint then acts as two springs. With screw stiffness ks and clamped-member stiffness km, an axial external load Fe adds only ΦFe to the screw force, Φ = ks/(ks + km), while the clamped faces stay in contact; they separate at Fe = Fi/(1 − Φ). Until then preload sets the mean screw stress and the load swing the amplitude, so a Goodman-type check, σa/σe + σm/σu ≤ 1 (endurance limit, ultimate strength), needs both. Chewing-type loads are oblique: they tip the abutment and open the tension side before the axial rule predicts, which only a contact model with friction, a preload step and the real load direction carries.
- Preload clamps the joint. Tightening stretches the screw and clamps the abutment to the implant. Only a small part of the torque becomes preload, because most is spent on friction in the threads and under the head, so friction and torque are calibrated together. The shank carries the tension, and its mean stress is set by the preload.
- Oblique chewing-type load. The load arrives off the implant axis. It adds an axial part and a bending moment that tips the abutment. The model applies it as a cyclic load in the direction and at the height that your test or use case defines.
- Opening on the tension side. Tipping lifts the abutment from the platform on the side away from the load while the other side presses harder. The gap can appear before the average axial load would separate the joint, and the screw feels it on every cycle.
- Conical seat and friction. In a conical connection the stem wedges into the implant and friction in the cone carries part of the lateral load. Cone angle, surface condition and friction coefficient decide how much the screw is relieved, so they are inputs with ranges, not constants.
- Screw stress cycle. Preload sets the mean stress. The load swing sets the amplitude, the share of the swing the screw takes while the joint stays closed. Mean and amplitude go together into a Goodman-type fatigue check.
- Screw force against load. While the faces stay in contact, the screw force rises slowly with load and the clamp force falls. Once the joint opens the screw takes the whole increment and the amplitude jumps. A model must find this transition, and torque, friction and joint stiffness move it.
Bench tests alone do not separate the causes. The review found ten in vitro studies with torques of 20 to 45 Ncm, 16,667 to 1 million cycles and torque loss of 16.1% to 39%, and disagreement on which connection holds preload best; specimens sat in acrylic (17 GPa), aluminium (70 GPa) or stainless steel (190 to 210 GPa).
We model contact and friction at head seat, cone and threads, then preload and oblique cyclic load, and report preload retained, tension-side opening and screw stress, calibrated to your torque-loss records.
What does dental implant simulation show about bone density and micromotion?
Sugiura and colleagues (2016) built a posterior mandible from CT, converted CT values to density and density to modulus with Keyak's equations, and varied cancellous density, crestal cortical density and crestal thickness. Low and high cancellous cases, 150 and 850 Hounsfield units, gave moduli of 0.259 and 3.507 GPa. A 200 N load at 30° to the implant axis acted on the abutment; immediate loading was frictional contact (coefficient 0.3), delayed loading a bonded interface.
Maximum micromotion reached about 100 µm with low-density cancellous bone and stayed under 30 µm with high-density bone; cortical thickness mattered strongly only when cancellous density was low. Peak compressive strain in the crestal cortex was 1.51 to 2.34 times higher under immediate than delayed loading. That interaction needs a grid, not one-at-a-time sweeps.
- Oblique loading. A chewing-type load acts on the crown at an angle to the implant axis. Its direction, size and point of application are parameters of the model. They come from your use case or test fixture, not from the model.
- Micromotion at the interface. Micromotion is the relative displacement between implant and bone at the contact. Under immediate loading the interface is a frictional contact, not a bonded one, so the implant can rock: the neck moves toward the loaded side and the apex the other way.
- Crestal strain. The load passes into the crestal cortical bone, and strain concentrates at the crest on the compression side. It is a model output that depends on the bone modulus map, the cortical thickness and the friction at the interface.
- CT value to density to modulus. Computed tomography grey values are calibrated to apparent density, and a published law turns density into modulus. The law, its source and its scatter go on record, and the modulus map is varied across its range, not fixed at one value.
- Crestal cortical thickness. The crestal cortex is thin and differs between sites. Its thickness is a parameter swept together with density, because its effect can depend on the cancellous bone beneath it.
- Micromotion against density. Qualitatively, micromotion falls as cancellous bone gets denser. In low-density bone the cortical thickness separates the two curves; in dense bone they converge. The dashed line is the limit your team sets: where it sits comes from your acceptance criteria, not from the simulation.
The authors name the limits: homogeneous, isotropic, linear elastic bone, a fixed load direction and fixed boundaries, so values "could not be directly compared with clinical threshold values". Material data dominates: the plate study below gives cancellous bone 142 MPa where this study's standard model uses 1,370 MPa. We treat bone as a mapped, ranged input, with the CT-to-modulus law and its source on record.
How are jaw and facial fixation plates simulated?
Fixation asks what plate, screws and bone share. Abd Elfattah and colleagues (2026, BMC Oral Health) compared two conventional miniplates with a patient-specific titanium plate for a mandibular angle fracture, in a CT-based model under static unilateral clenching (temporalis 329.2 N, masseter 272 N, medial pterygoid 174.8 N). Peak plate von Mises stress was 417.48 MPa against 326.19 MPa; cortical maximum principal stress 87.759 against 121.03 MPa; fragment displacement 131.47 against 157.32 µm (miniplates first).
One output improved while two moved the other way, the usual shape of a fixation trade-off. The authors list one anatomy, two designs differing in plate and configuration, static loading and no fatigue as limits, and checked one displacement against a published value (70.246 against 71.92 µm). We ask for a physical comparison on your construct and treat plate and screw fatigue as a cyclic question.
Can finite element models support surgical planning tools?
Yes, as engineering software: our craniomaxillofacial page lists finite element tool development for surgical planning and preparation. The chain becomes a template, from segmentation and a CT material map to a load library, a run script and a fixed report of strains, stresses and displacements with ranges. It makes no treatment recommendation and predicts no individual patient's outcome; whether such software is itself regulated depends on its intended use, settled between manufacturer and regulator.
| Question | What the model carries | What it reports | Decision it supports |
|---|---|---|---|
| Abutment screw loses torque | Contact, friction, preload, oblique cyclic load | Preload retained, tension-side opening, screw stress | Connection variant, friction target |
| Size for the ISO 14801 bench | Fixture geometry of each combination | Screw-joint and critical-section stress ranking | Shortlist, agreed against the standard |
| Implant in low-density bone | CT-mapped density, crestal cortex, contact | Micromotion and bone strain as ranges | Thread and body design, test cases |
| Jaw fixation plate layout | CT mandible, muscle loads, plates, screws | Plate stress, bone stress, fragment displacement | Plate configuration, screw positions |
| Planning tool for a case family | Parametric template and load library | The same outputs as ranges per case | Which cases need the full model |
Where does ISO 14801 end and dental implant simulation begin?
ISO 14801:2016, Dentistry — Implants — Dynamic loading test for endosseous dental implants, specifies dynamic testing of single post endosseous dental implants of the transmucosal type with their premanufactured prosthetic components. It is not a test of the fundamental fatigue properties of the materials, excludes endosseous lengths shorter than 8 mm and, though it simulates functional loading under worst-case conditions, is not applicable for predicting in vivo performance.
Before the build, a model ranks a series' implant and abutment combinations by screw-joint and critical-section stress, so the bench gets the combination the physics points to, agreed against the standard. After it, the model is calibrated to what failed (friction and preload from torque records, the fracture site from fractography) before it serves untested variants.
How far a model counts is a risk question. ASME V&V 40-2018, Assessing Credibility of Computational Modeling through Verification and Validation: Application to Medical Devices, frames whether completed verification and validation is relevant and adequate, given how much the model is relied on and what a wrong decision costs. FDA's final guidance of November 2023, Assessing the Credibility of Computational Modeling and Simulation in Medical Device Submissions, offers a risk-informed framework for physics-based models. Our context of use: the model ranks four connection variants by preload retention and screw stress amplitude to pick two for the bench, and the bench result stays the evidence. That is low model influence, so verification (mesh and contact convergence) and validation against your torque and fatigue records are sized to it. To replace a test, the evidence rises and the regulator or notified body is asked first, for example in a pre-submission meeting.
A model result is not a test result or a clinical statement
Where does AI help dental implant design, and where does it not?
Surrogates pay where one model runs many times. Kung and colleagues (2023) trained a network on finite element results for 115 implant geometries with 26 parameters and 36 types of boundary condition; its mechanical responses correlated with finite element above 93%. The authors note that wide variation in boundary conditions cannot be fully covered by training data, and that behaviour beyond their range, bone property ratios of 0.42 to 1.00 and occlusal forces of 75 to 139 N, remains unexamined.
- Connection screening. Taper, screw, thread, preload, friction and load angle train a surrogate for preload retained and screw stress amplitude within a stated range; finalists get full runs. See surrogate models for CFD and FEA.
- Bone and plate sweeps. Density, cortical thickness and load direction give micromotion ranges; plate layouts give a front of plate stress against fragment displacement.
- Calibration. An inverse fit to torque-loss data returns friction and preload as ranges.
It does not set an acceptable micromotion, replace the bench test or extrapolate, and it inherits the errors of the model beneath it. We check it on held-out full runs and send anything outside its range to the full model. See AI surrogate models you can sign off and uncertainty quantification.
From one connection study to a workflow you keep
The return comes when your engineers can put the next connection, bone case or plate layout through the same chain without rebuilding anything.
- Physics model. CFD and FEA set up once, as templates: geometry clean-up, mesh, solver settings and post-processing that every later run reuses.
- Validation. Mesh and time-step studies, and comparison with tests or full-scale data, so the model's uncertainty is known before it is trusted.
- Automated runs. Scripted runs over the parameters and operating conditions that matter, on your hardware or in the cloud.
- AI surrogate. A machine-learning model trained on those runs answers in seconds and says how sure it is; low-confidence questions go back to the solver.
- Decision tool. Optimisation, trade-off charts or operating guidance, in a form your engineers and operators use every day.
- Field data. Test, trial and monitoring data flow back to recalibrate the model, so it improves with every project instead of being rebuilt.
- A connection template in your existing solver: implant, abutment, screw, contacts, preload step, oblique cyclic load.
- A bone-case library with the CT-to-modulus law, its source and range, cortical thickness and load direction.
- A calibration script from your torque-loss and fatigue records to friction and preload ranges.
- A validation record against your bench constructs, tolerances set before the run.
- A surrogate with a stated range and a gate that sends anything outside it to the full model.
- Handover and training, so your team runs and extends it. See our training and software development services, and the medical devices hub.
Questions engineers ask about dental implant simulation
What does ISO 14801 test?
Why does an abutment screw loosen?
Does bone density change implant micromotion in a model?
Can finite element analysis replace the dental implant fatigue test?
If a connection redesign, an ISO 14801 build or a plate layout is waiting on a model, send us the implant, abutment and screw CAD with the preload specification, your torque-loss or fatigue records, the bone-density range you design for and, for plates, your test construct and load case. We reply with how we would build the model, the outputs it would report as ranges and what the validation record should contain. Start with a conversation, or read the orthopedic and dental implants and craniomaxillofacial pages.