Orthopedic implant simulation for fatigue, stress shielding and micromotion
A stem family is a week from design freeze and the endurance bench has room for one size. Simulating the stress cycle, the strain left in the bone and the interface micromotion across every size and a lattice option shows where the worst case sits, before the test slot is spent.
Orthopedic implant simulation predicts how a hip stem, tibial tray, bone plate or spinal construct carries physiological load: the stress and fatigue margin in the metal, the strain left in the bone, and the micromotion at the interface. We build it around your existing solver, so the worst-case size, a lattice change or a new geometry is compared before a bench slot is booked or the design is frozen.
The stem family is a week from design freeze. The endurance bench has room for one size, the plan says to test the worst case, and nobody has shown which size that is for the new proximal geometry. A graded lattice in the upper stem adds three questions: will the struts survive the cycles, how much load returns to the bone, and does the stem stay still in the canal?
What does orthopedic implant simulation have to answer?
Three quantities, three kinds of physics: the stress cycle at the implant's critical section, the strain in the bone around it against the intact femur, and the relative movement at the interface over a load cycle.
Bone strain follows from load sharing. For a stem and bone section deforming together under axial force F, εb = F/(EbAb + EsAs), so the bone keeps 1/(1 + EsAs/EbAb) of its intact strain; bending puts E·I in the same role. Liu and colleagues' 2021 review of porous femoral stems quotes 110 to 230 GPa for stem metals against 0.3 to 22 GPa for bone, and links the lost stimulus in the proximal femur to bone resorption. The model reports the strain gap. Whether bone is lost is biology outside it.
- Joint load on the head. The joint force acts through the head, to one side of the stem axis, so the stem is loaded as a column and a beam at once. Its direction and size are inputs, and walking is not the only demanding activity.
- Solid stem, large share. Metal is far stiffer than bone, so a solid stem carries most of the load. In the idealised parallel case the bone keeps 1/(1 + EsAs/EbAb) of its intact strain, and bending brings E times I into the same role. The load passes to the bone lower down.
- Shielded proximal bone. Where the stem takes the load, the bone strain falls below the intact femur. This gap is what the model reports, zone by zone. Reviews link it to bone resorption; whether that follows is biology the model does not predict.
- Graded lattice stem. An open lattice in the upper stem lowers its stiffness, so the proximal bone takes a larger share. The neck stays solid. Struts and nodes concentrate stress and as-built fatigue strength is often lower, so the strut stress gets its own check.
- Strain along the stem. Bone strain relative to the intact femur, from the top of the stem to the tip, for each design. The dashed line is the intact femur and the gap to it is the shielding. The curves move with load case, bone density and friction, so they are swept, not computed once.
- Interface micromotion. The implant surface slides a small distance against the bone over each load cycle. It depends on friction, press-fit and bone stiffness. A 2021 systematic review found no universal limit, so designs are ranked under the same conditions.
How is implant fatigue assessed, and where does the model fit?
Construct-level fatigue is settled on the bench. ISO 7206-4:2010 specifies the endurance test method for stemmed femoral components, including test parameters and endurance-limit requirements. Other constructs have counterparts, listed below.
The finite element side has ASTM F2996, titled Standard Test Method for Finite Element Analysis (FEA) of Non-Modular Metallic Orthopaedic Hip Femoral Stems in its 2024 edition. Its context of use is to identify the worst-case size in a series and then test that size. In its own comparison with strain gauging at two laboratories, stresses correlated to within 8%. It applies only below yield and is limited to static analysis, which excludes the prediction of fatigue strength.
Fatigue is a step you add. From the stress history at the critical section take the mean stress σm and alternating stress σa and compare them with Goodman's line, σa/Se + σm/Su = 1/n, with endurance limit Se, ultimate strength Su and safety factor n. Soderberg's line, with yield strength, is more conservative. The Liu review notes that additively manufactured porous stems often have lower fatigue strength than solid ones, so Se comes from tests on the as-built lattice.
- Cyclic load and lever arm. The bench loads the head along a fixed line that passes to one side of the stem axis. The offset e puts a bending moment on top of the axial load. The line, the angles and the force range come from the standard you test to, and are model inputs.
- Embedding. The distal stem is held in an embedding block, so the level and stiffness of the embedding set where the constraint acts. A small change in level moves the critical section, which makes it a validated input, not a detail.
- Tension and compression. The offset load bends the stem: one side in tension, the other in compression. Tensile stress drives fatigue cracks, so that side is where the stress cycle is read.
- Hotspot. The peak stress sits where section, constraint and any notch, pore or lattice node combine. In a study of stems with holes in the proximal region, quoted in the Liu review, the high-stress regions were the middle lateral region and the areas around the holes. The mesh must resolve it, so its peak is checked for convergence.
- Strain gauge. The bench measures strain at gauge positions. ASTM F2996 describes comparing calculated stresses with strain gauging. The same positions are probes in the model, with a tolerance set before the run.
- Goodman window. The stress history at the hotspot gives a mean and an alternating stress, plotted against a line from the endurance limit to the ultimate strength. The margin is the distance along the load-ratio ray to the line. The lower dashed line shows how scatter in an as-built lattice shrinks it.
How do you pick the worst-case size?
Sizes do not scale together: section, neck offset and canal fill change at different rates, so the critical size depends on the load case, and a new proximal geometry can move it. We run every size through one parametric template and rank peak stress at the critical section with its uncertainty band in view.
Anatomy is a second family. Cilla and colleagues (2017) varied four dimensions of a short hip stem over four levels, 256 models, on one representative femur from a study of 100 patients, and name more femur geometries as a next step. We sample bone geometry and density, so a ranking holds across a set of femurs.
What does micromotion at the interface tell you?
Micromotion is the relative tangential displacement between implant and bone surface over a load cycle, and it depends on friction, press-fit, bone stiffness and load case, each uncertain. Kohli, Stoddart and van Arkel (2021) note that an early 150 µm limit became an oft-cited gold standard on inconclusive 1990s evidence. In the animal data they compiled, osseointegrated implants ran from 15 to 750 µm and non-osseointegrated ones from 30 to 750 µm; the first group moved less on average, at 32% of the second, but the ranges overlapped. They found no universal limit.
So we use micromotion to rank designs on the same bone, load case and friction sweep. A ranking that flips inside the friction range means the design is not yet understood.
What changes for porous and lattice implants?
Open lattices lower stem stiffness. The Liu review gives the Gibson and Ashby relation E/Es = C(ρ/ρs)n, with C from 0.1 to 4.0 by unit cell and n typically 1 to 3, and reports mixed outcomes for graded designs: in studies it cites, an axial gradient reduced proximal-medial shielding and a radial gradient with a dense shell did not.
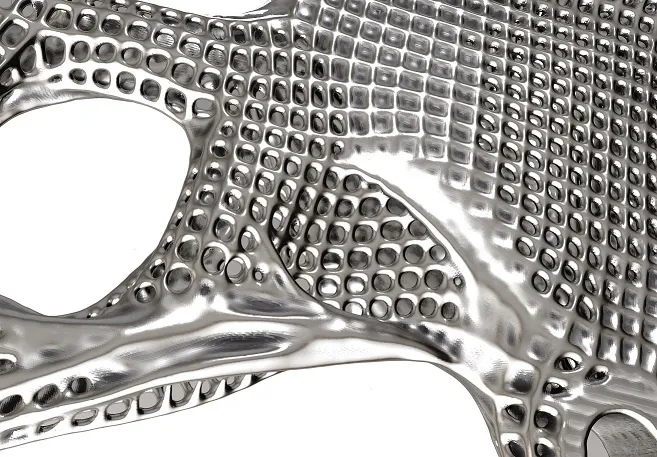
The model needs two scales: a homogenised lattice, calibrated on your coupons, for load transfer and micromotion, and explicit struts in the loaded region for the strut and node stress that fatigue needs. The review adds that percussion during insertion may fracture porous structure, so insertion is a load case. See metal additive manufacturing distortion simulation and lattice and topology optimization.
Can CT-based bone modelling be a design aid?
CT grey values become element stiffness through a published density-modulus correlation, as in the short-stem study above. The mapping is a model with inputs of its own, correlation, segmentation and load case, which we sweep. A set of CT-mapped bones lets you compare implants on the same bone. It is a design aid; it does not predict what happens in an individual patient.
How do you make an implant model credible?
Two documents frame it. ASME V&V 40-2018, Assessing Credibility of Computational Modeling through Verification and Validation: Application to Medical Devices, says credibility should be commensurate with how far the model is relied on as evidence and the consequences of a wrong decision. FDA's final guidance, Assessing the Credibility of Computational Modeling and Simulation in Medical Device Submissions, announced in the Federal Register on 17 November 2023, gives a risk-informed framework for credibility assessment in regulatory submissions. See our medical device simulation hub.
Our context of use: the model informs which stem sizes go to the endurance bench. The bench test stays, so the model only narrows a selection, but a wrong pick leaves the true worst case untested, and that consequence sets the evidence level; ranking lattice densities in concept carries less. Verification is mesh convergence on the peak stress; the short-stem study accepted local strains changing by no more than 5% between refinements. Validation is a strain-gauge comparison on your fixture, tolerance set before the run; the 8% in F2996 is that standard's statement, not a number we promise for yours. Uncertainty is swept: embedding level, load line, friction, density correlation, endurance limit.
A fatigue margin is not an endurance test
| Construct and standard | What the model carries | What it reports | Decision it supports |
|---|---|---|---|
| Hip stem family: ISO 7206-4, ASTM F2996 | Bench set-up, every size | Peak stress, gauge-point strain | Which size goes to the bench |
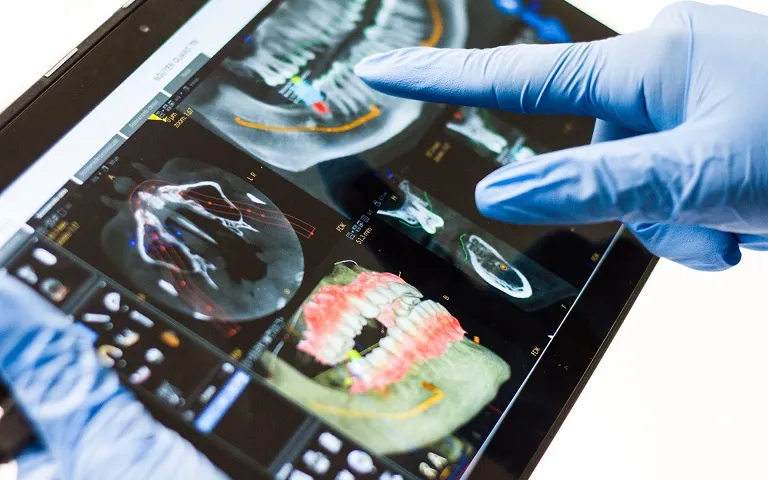
| Stem in a CT-based femur | Bone stiffness from CT, contact, load cases | Bone strain against intact, micromotion | Stem length, stiffness, geometry |
| Porous or lattice stem | Homogenised lattice, explicit struts, insertion load | Strut stress, stiffness, fatigue margin | Lattice density and grading |
| Tibial tray: ASTM F1800 | Tray, support, constant-amplitude force | Stress cycle in the tray | Tray section before the fatigue test |
| Bone plate and screws: ASTM F382, F543 | Bend, bending fatigue or torsion set-up | Stress at screw holes, screw torsion | Plate section, hole spacing, screw geometry |
| Spinal construct: ASTM F1717, F2077 | Rods, screws and blocks in the test set-up | Construct stiffness, stress at junctions | Configuration to put on test |
Where does AI help, and where does it not?
- Size and shape screening. Cilla and colleagues trained a neural network and a support vector machine on their 256 runs and searched for a geometry with less shielding. Test errors stayed under 10% in most zones, and zones above that were left out of the choice. The models needed grow exponentially with the parameters, and the optimised stem still showed some shielding. See surrogate models for CFD and FEA.
- Lattice homogenisation. A surrogate trained on unit-cell runs returns effective stiffness and strut stress inside its range.
- Calibration. Friction and density constants are fitted to your bench and coupon data as a range.
A surrogate cannot be trusted outside the range it was sampled over, inherits every error of the finite element model, and does not settle the worst case: the size it picks is rerun in the full model before the bench. See surrogate and reduced-order models, uncertainty quantification and AI surrogate models you can sign off.
From one implant study to an orthopedic workflow you keep
The return comes when your engineers can run the next stem size, lattice or plate revision through the same chain unchanged.
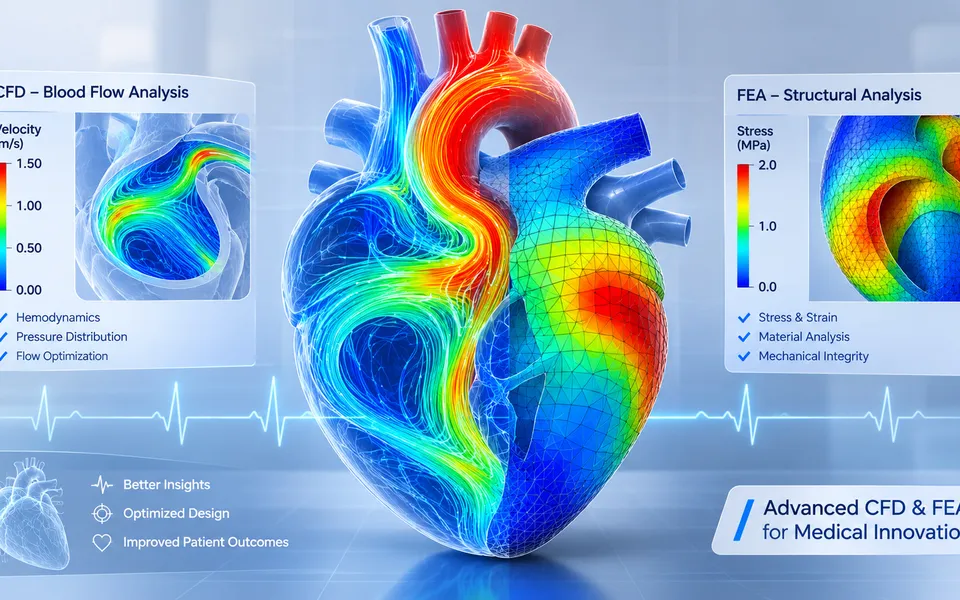
- Physics model. CFD and FEA set up once, as templates: geometry clean-up, mesh, solver settings and post-processing that every later run reuses.
- Validation. Mesh and time-step studies, and comparison with tests or full-scale data, so the model's uncertainty is known before it is trusted.
- Automated runs. Scripted runs over the parameters and operating conditions that matter, on your hardware or in the cloud.
- AI surrogate. A machine-learning model trained on those runs answers in seconds and says how sure it is; low-confidence questions go back to the solver.
- Decision tool. Optimisation, trade-off charts or operating guidance, in a form your engineers and operators use every day.
- Field data. Test, trial and monitoring data flow back to recalibrate the model, so it improves with every project instead of being rebuilt.
- A parametric implant template in your existing solver, with the size family, materials, contacts and the bench set-ups of the standards you test to.
- A bone model builder that maps CT grey values to stiffness, with the correlation as a parameter, across a set of femurs.
- A post-processor that writes stress cycles, Goodman or Soderberg margins from your coupon data, bone strain against intact and interface slip.
- A validation record against a strain-gauge test on your fixture, with tolerances set before the run.
- A surrogate with a stated range in size, geometry and lattice parameters, and a gate to the full model outside it.
- Handover and training, so your team runs and extends it. See our training and software development services.
Questions engineers ask about orthopedic implant simulation
What is stress shielding in a hip implant?
Can finite element analysis replace the endurance test of a hip stem?
What micromotion is acceptable at the bone-implant interface?
How is the worst-case size of an implant family chosen?
Which standards apply to orthopedic implant testing?
If a size selection or a lattice proposal is waiting on a stress number, send us the implant drawings with the size family, material and process (solid, porous or additively manufactured), the standard and fixture you test to, any strain-gauge or endurance records, and the decision the model must support. We reply with how we would build the model, the outputs it would report, what the validation record should contain, and the context-of-use question for your regulator. Start with a conversation, or read the orthopedic implants capability page.