Cemented carbide simulation from WC-Co grains to sintering shrinkage and stress
The insert sinters out of shape, or the brazed tip cracks on cooling, although the grade is on specification. Grain-scale models, compaction and sintering models and a cooling-stress analysis show which step is responsible.
Cemented carbide simulation predicts what a WC-Co hard metal does at the grain scale, how a pressed compact shrinks and distorts in the furnace, and what residual stress the part carries after cooling, brazing and coating. We build it as a repeatable chain around your existing solver, with a validation record and a surrogate of stated range, so a grade, an insert geometry or a coating route is judged before the next press tool, sinter run or batch of inserts.
The new insert geometry sinters out of tolerance and the press tool is recut. A brazed carbide tip cracks on cooling, or a punch insert chips at its first radius although the grade sheet is on specification. Staf and colleagues (Powder Technology, 2019) describe the loop for cutting inserts: powder is pressed to roughly half its volume, die friction leaves density gradients, sintering shrinks the compact unevenly, and the pressing tool must be compensated, which simulation lets you do before it is manufactured.
What does cemented carbide simulation have to predict?
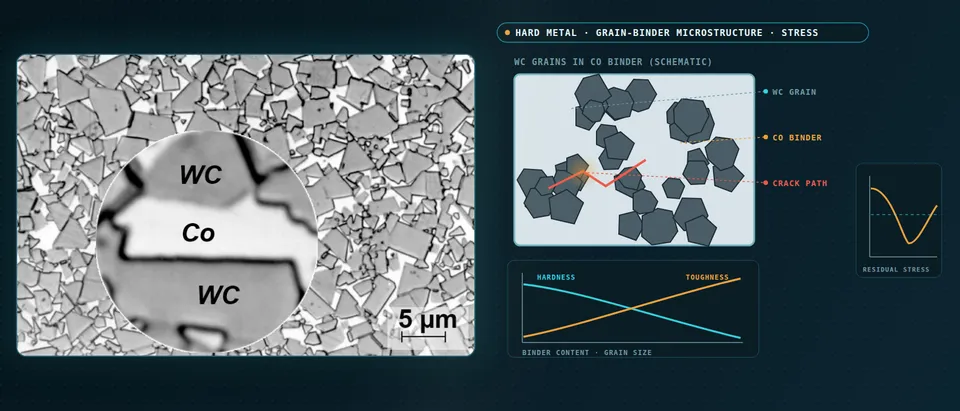
Hard metal, or cemented carbide, is hard carbide grains, usually WC, in a tough metallic binder, usually Co-rich. Three questions run on three clocks: how grain size and binder fraction set toughness and where a crack starts; how pressing and sintering turn a powder compact into a blank; and what stress the part carries after cooling, brazing and coating. We run them as one chain. Weidow and colleagues (2025) note that tools can see temperatures of the order of 1000 °C and applied stresses up to about 2 GPa, and that residual stress affects strength, dimensional stability and fatigue life. For model scale in general see composite modelling scale.
How do grain size and binder set hardness, toughness and strength?
Hardness follows a Hall-Petch relation in WC grain size, H = H0 + k d−1/2; toughness moves the other way, because the binder carries it. Llanes and colleagues (13th European Conference on Fracture) tested five commercial grades, about 10, 16 and 27 vol% Co with 0.8 and 2.5 µm carbide: toughness rose from 7.5 to 16.0 MPa√m with the cobalt mean free path. Strength did not follow, 1676 to 2742 MPa: every specimen broke from a pore, binderless carbide cluster or agglomerate, with critical sizes of 8 to 42 µm. With KIC = Yσ(πa)1/2 the flaw sets the strength, so a microstructure model needs the flaw population, which we calibrate from your fractography and flexural data.
Why does a WC-Co part carry residual stress, and which way?
Liquid-phase sintering takes place around 1400 °C, and on cooling the binder contracts more than the carbide. The mismatch strain is the integral of (αCo − αWC) over the range in which the binder can carry load, so the binder ends in tension and the carbide skeleton in compression. With no load and no gradient the volume-averaged phase stresses balance, VWCσWC + VCoσCo = 0, so at 10 vol% binder the binder carries nine times the carbide stress. Weidow and colleagues measured compressive carbide stress by neutron diffraction in three WC-10 vol% Co grades. Their binder estimates, 1.8 to 4.6 GPa depending on the route, suggest that the binder yields in cooling and that force balance oversimplifies, so its temperature-dependent flow curve is a calibration target.
Fraction and grain size are not the whole state. Their Cr and Ti grade, at a grain size and binder fraction close to the Cr-only grade, had the lowest carbide stress, and they call their calculated binder-to-carbide expansion mismatch, which swings with small composition changes, highly uncertain. Öhman and colleagues (2019) show the route we follow: voxel 3D WC-Co microstructures, periodic boundary conditions, homogenisation, anisotropic carbide grains, cooling from sintering temperature. They report good agreement with measured properties and residual stresses, compare elastic and elastoplastic binders, and find a substantial dependence on grain morphology. We read grain statistics from your micrographs; in the Weidow grades the EBSD standard deviation is roughly half the mean, so one diameter is the wrong input.
- Cooling pulls the grains through the binder. After liquid-phase sintering the cobalt-rich binder tries to contract more than the carbide grains as the part cools, so each binder pocket pulls on the grains around it, the converging arrows. The mismatch strain is the integral of the expansion difference, α(Co) minus α(WC), over the temperature range in which the binder can carry load. It is the load case, not a correction to one.
- Binder in tension, carbide in compression. Averaged over the part, the plus signs in the binder and the minus signs in the grains balance. Local values differ from the average: tungsten carbide is anisotropic, and pockets, corners and boundaries concentrate stress, so the shape of the grains moves the stress field, not only the volume fractions.
- Clusters and pores start the crack. Fracture origins in hard metals are processing flaws: pores, binderless carbide clusters and agglomerates, the dashed outline and the pore. Their size and the contact between grains, not the mean grain size, set the strength, so the flaw population has to be in the model or in its calibration.
- The crack crosses carbide, boundaries and binder. The solid segments cut through carbide. The dashed, moving segments run through the binder, where ductile ligaments bridge the crack faces, the blinking bars, until they neck and fail. Interface cracking and binder plasticity are separate laws, each calibrated; leave one out and the load capacity or the crack path is wrong.
- Equal areas, and a yield level. The bars show volume times stress. A small binder volume carries a high tensile stress to balance a larger volume of carbide at modest compression: the sum of volume times stress is zero when no load acts and the stress is uniform. The dashed line marks the binder's flow stress; once it yields, hardening, not elasticity, sets how far the tension grows, so its temperature-dependent flow curve is a calibration target.
- A mean grain size hides the tail. Grain sizes are spread widely. The histogram has a tail of large grains, the blinking bars, well beyond the dashed mean, and large grains and aggregates are where cracks are reported to start. A model built from one diameter has neither, so we build the structure from the measured distribution and the contact between grains.
How do you predict sintering shrinkage and distortion?
Distortion starts in the die. Wall friction leaves density differences of ±10 to 20 per cent across a pressed compact, and sintering shrinks dense and light regions unevenly. Staf and colleagues model compaction with an extended Drucker-Prager cap law, a density-dependent yield surface with many parameters, in LS-DYNA with Coulomb wall friction. Instrumented-tool tests gave useful but insufficient data for the parameters, so they imaged compact density with thermal neutrons, since X-rays penetrate tungsten carbide poorly, and found good agreement with the simulation. We calibrate compaction on your density maps and the shrinkage law on dilatometer curves and scanned blanks, check both on a geometry the fit has not seen, and feed the predicted shape error back into the tool: an iteration costs a simulation, not a tool and a furnace run.
What do brazing and coating add to the manufacturing stresses?
Bakken and colleagues (2024) measured CVD (Al,Ti)N coatings on cemented carbide by in-situ synchrotron diffraction. As deposited, the coating was in tension at room temperature, 0.43 GPa on the {200} reflection; the carbide substrate expands less, so on heating the stress turns compressive, the state expected in service. A 3-hour post-anneal at 850 °C lowered the tension to 0.10 GPa. A room-temperature stress map is half the load case: the model runs the temperature history. A tip brazed to a steel shank is the same mismatch with steel as the partner; the sign depends on geometry, interlayer and cooling rate, so we model the furnace cycle. Service cycling is the problem of our thermomechanical fatigue article; carbide die inserts are in our cold forging and hot forging die articles.
- Die-wall friction leaves a density gradient. The upper punch pushes powder down the die. Friction against the walls, the dashed arrows, resists the motion, so the compact is denser near the moving punch and lighter towards the fixed one. The compaction model needs a density-dependent yield surface and a wall-friction law, and the density map it predicts can be measured.
- Uneven density, uneven shrinkage. Sintering removes the pores, and the lighter regions shrink more than the dense ones. The blank shrinks towards the dashed outline unevenly, short arrows at the dense top and longer ones at the lighter foot, and comes out barrel-shaped instead of a scaled copy of the pressed shape.
- The shape error feeds back into the tool. Because the shape error is predicted, it can be fed back: the press tool is cut with a compensated geometry before it is made, so the sintered blank lands near the target. Each pass around the loop is a simulation, not a tool and a furnace run.
- Coating stress changes sign with temperature. A coating on a carbide substrate carries the thermal mismatch between the two. In a measured CVD coating the stress was tensile at room temperature and turned compressive at service temperature; the panel alternates between the two states. A tip brazed to a steel shank is the same mismatch with steel as the partner, and which side is in tension depends on geometry and cooling.
- Each model is calibrated on a measurement. The compaction model on a density map of a pressed compact, the sintering model on dilatometer curves and scanned blanks, the stress model on diffraction or substrate-curvature measurements. Without them the parameters are guesses; with them the chain returns a range, not a point.
Where does a crack start, and which damage model fits?
Özden, Bezold and Broeckmann (19th European Conference on Fracture) modelled fatigue crack growth in WC-Co in Abaqus on a 2D microstructure from SEM images: XFEM with a linear-elastic fracture law for the carbide, plastic-strain damage for the binder. Cracks began at carbides or clusters and grew through the binder. Their listed limits show what each choice gets wrong: no carbide initiation criterion, so the crack stopped at the binder-carbide transition; binder hardening borrowed from a 316 steel; an arbitrary critical plastic strain of 0.015. Postek and Sadowski (2016) add cohesive interfaces: stress concentrates at junctions, the first crack appears there, and capacity is overestimated without an interface crack model. A traction-separation law, Gc = ∫T dδ, needs elements well below the cohesive-zone length. We choose by question: cohesive interfaces for initiation, ductile damage in the binder for path and toughness, homogenised properties with a flaw criterion at component scale.
Which hard metal question needs which model?
| Question | Model | Reports | Limit to state |
|---|---|---|---|
| Stiffness and expansion of this grade? | Periodic voxel microstructure, homogenisation | Effective properties | Grain distribution, anisotropy |
| Stress sign after cooling? | Microstructure cooled from sintering, elastoplastic binder | Carbide and binder stress fields | Binder flow curve, composition, grain shape |
| Where does a crack start? | Cohesive interfaces, flaw criterion | Initiation site, path | Interface strength calibrated; flaw size from fractography |
| What shape leaves the furnace? | Cap-plasticity compaction, sintering law | Density map, distortion | Wall friction; fit to density and dilatometry |
| Will the brazed or coated part crack? | Component model over the thermal cycle | Stress at room and service temperature | Starting coating stress, interlayer data |
| Sweeps over binder and grain size | Surrogate on designed runs | Property maps | Sampled range and inputs only |
A calibrated model is not a qualified grade or tool
Where does AI help hard metal design, and where does it not?
- Surrogates over binder fraction and grain statistics. Trained on designed microstructure runs, they return effective stiffness, expansion and phase-stress averages inside a stated range, with a gate to the full model. Grain-size spread and contact must be inputs, since Öhman and colleagues found stress depends substantially on grain geometry.
- Calibration and compensation. We fit the sensitive compaction parameters to density maps, dilatometry and shape scans within physical bounds, hold a geometry back, and use a surrogate of shape error to run the compensation loop on designed cases.
It does not repair a wrong binder flow curve, and it cannot see what is not an input: in the Weidow grades stress followed dopants that grain size and binder fraction do not capture, so a surrogate over those two inputs would have missed it. Ours state their range and ignored inputs. See our surrogate modelling, hybrid physics-AI and uncertainty quantification pages and our articles on surrogate models and validating them.
From one grade or insert to a workflow your team keeps
The return comes when the next grade, geometry or coating route goes through the same chain.
- Physics model. CFD and FEA set up once, as templates: geometry clean-up, mesh, solver settings and post-processing that every later run reuses.
- Validation. Mesh and time-step studies, and comparison with tests or full-scale data, so the model's uncertainty is known before it is trusted.
- Automated runs. Scripted runs over the parameters and operating conditions that matter, on your hardware or in the cloud.
- AI surrogate. A machine-learning model trained on those runs answers in seconds and says how sure it is; low-confidence questions go back to the solver.
- Decision tool. Optimisation, trade-off charts or operating guidance, in a form your engineers and operators use every day.
- Field data. Test, trial and monitoring data flow back to recalibrate the model, so it improves with every project instead of being rebuilt.
- A grade generator in your existing solver: voxel microstructures from grain-size distribution, binder fraction and contact, each phase property with source, range and sensitivity rank.
- A compaction-to-sinter template per insert or die family, the compensation loop scripted and hand-over files versioned.
- A stress record for cooling, brazing and coating routes over the whole temperature history.
- A validation record of your hardness, toughness, flexural, density, dilatometer, shape and diffraction data, tolerances set first.
- A surrogate with a stated range, its ignored inputs listed, and a gate to the full model.
- Handover and training: our training and software development services.
How credible is a cemented carbide simulation result?
Verification is convergence: microstructure model size, element size against the cohesive length, time step and mass scaling in explicit runs, remeshing in compaction. Validation uses data you hold, with one grade or geometry held back. Uncertainty is sampled: binder flow curve, interface strength, wall friction, flaw size, powder lot. The answer is a range with ranked contributors.
Questions engineers ask about cemented carbide simulation
Can you build a WC-Co model from a micrograph?
Why does a sintered insert come out distorted?
Is residual stress in cemented carbide compressive or tensile?
Which solver do you use for hard metal models?
Does simulation replace grade or tool testing?
If a grade choice, an insert geometry or a coating route is waiting on this, send us the grade sheet with binder fraction, grain size and dopants, a micrograph with its scale bar, the pressed and sintered geometry with a scan of one blank, the brazing or coating route and a fractograph of a failed part. We reply with the model chain we would set up, the validation we would run and what a surrogate could cover. Start with a conversation, or see our hard metal simulation page.