Composite impact simulation for barely visible damage and compression after impact
The panel shows a dent you can barely see, then fails below the compression strength it was sized for. Ply damage, cohesive delamination, element erosion and rate effects in LS-DYNA or Abaqus/Explicit show what the hit did and what strength is left.
Composite impact simulation predicts, in an explicit solver such as LS-DYNA or Abaqus/Explicit, the force history of a hit, where the laminate cracks, delaminates and breaks fibres, and how much compressive strength the damage leaves. We build it as a calibrated, repeatable workflow around your own solver, with a validation record and a surrogate of stated range, so impact and compression-after-impact (CAI) testing targets the cases that decide the design.
A dropped tool leaves a dent you can barely see. Beneath it a cone of delaminations has formed, and the panel sized for ultimate compression fails below it. NASA Langley (Ambur and Kemmerly) report that test data show low-speed impact damage can significantly reduce compression strength even when visual inspection cannot detect it. So every layup, thickness and energy gets its own drop-tower and CAI campaign, and sizing, weight targets, repair thresholds and the crash-structure design freeze wait on it. AC 20-107B asks that impact damage up to the threshold of detectability be shown not to reduce strength below ultimate load, by analysis supported by test evidence or by building-block tests.
What does composite impact simulation have to predict?
Four things, in this order: the contact force history, whose drop marks where delamination starts; the damage state, meaning matrix cracks, a delamination footprint at each interface, fibre breakage and the dent; the split between energy returned and energy absorbed; and the residual strength, the number the design needs. For a crush structure the outputs become crush force and energy absorbed per unit mass.
AC 20-107B sorts damage by detectability. The likely impact damage at the threshold of reliable visual detection is barely visible impact damage (BVID), and damage that may go undetected must retain ultimate load; damage that inspection will find carries a lower demand, limit load or thereabouts. The model has to place that line.
Energy alone does not define the load case. In the NASA Langley tests, 48-ply quasi-isotropic plates were hit with impactor weights from 2.5 to 20 lb at matched energies: CAI strength differed by 10 to 20 percent, and at a given momentum the heavier impactor left the smaller damage area.
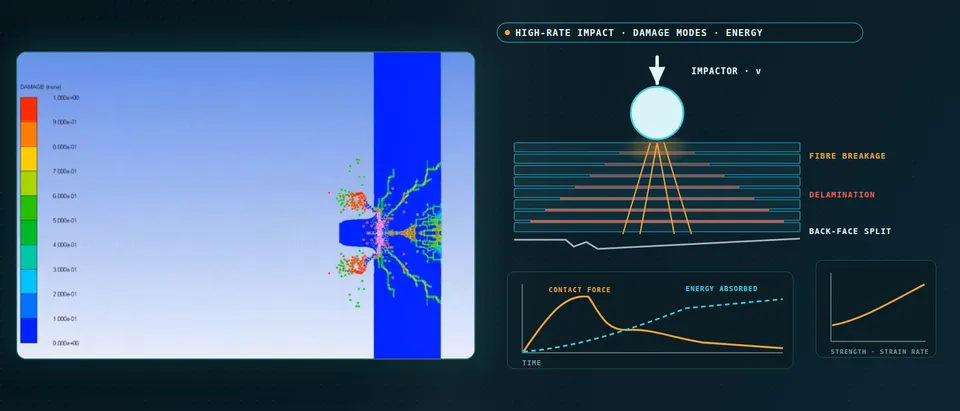
- The force history shows when delamination starts. The contact force rises with the stiffness of the plate and drops where the first major delamination opens, the pulsing ring, then recovers and falls as the impactor rebounds. The dashed curve is the energy absorbed, which flattens once the impactor leaves. NASA Langley's drop-weight study reads damage initiation from the loss of slope in this force. A model has to reproduce the drop before its damage footprint means anything.
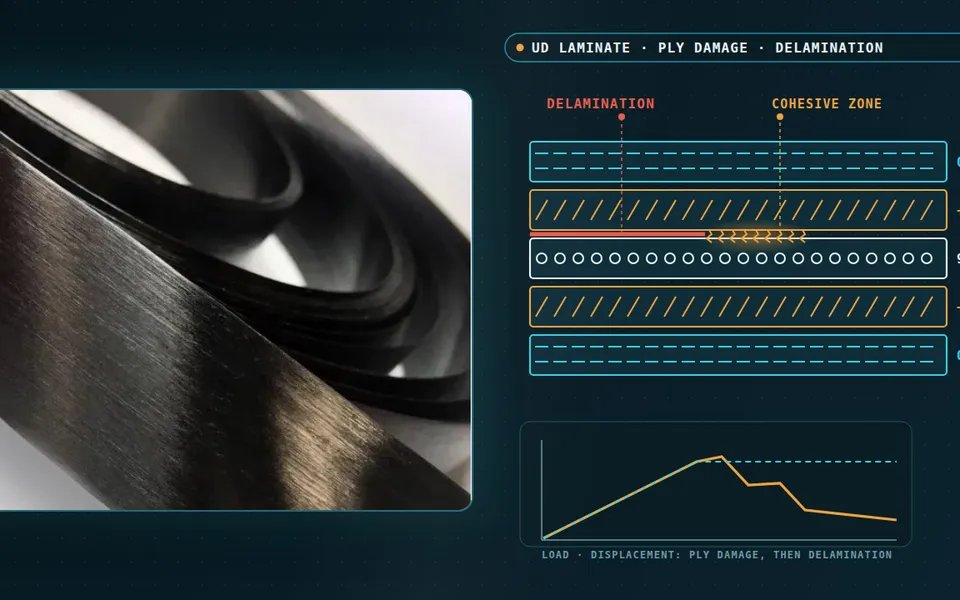
- Damage is a cone, not a dent. Inclined matrix cracks link a stack of lens-shaped delaminations, one per ply interface, and the footprint widens toward the back face as the pulses run down the stack. A small dent can hide a large delaminated area. Delamination lives at the interfaces, so the model needs interface elements or interface contact, not ply failure criteria alone.
- Fibres break at the back face. A flexing plate carries tension in its back face. A bending crack runs up from the bottom ply and fibres fail there, on the side nobody looks at, while the contact side shows only the dent. The fibres carry the load, so where they start to break has to be predicted, not assumed away.
- Returned energy and absorbed energy. The kinetic energy of the impactor splits into elastic energy returned in the rebound and energy absorbed by delamination, matrix and fibre damage, friction and heat. The absorbed share is what the damage laws must reproduce, and the energy ledger of the run, not only the force curve, shows whether they do.
- Compression after impact is the design question. Under end compression the damaged region lets sublaminates buckle, the alternating flat and buckled line, and the plate fails below its pristine strength, the shorter bar. The FAA's AC 20-107B calls the damage at the threshold of reliable visual detection barely visible impact damage, BVID, and it is the strength left with that damage that sizes the structure.
- The same energy does not mean the same damage. A light, fast impactor and a heavy, slow one can carry the same energy. In NASA Langley's tests on 48-ply quasi-isotropic plates, impactors of different weight at the same energy left compression-after-impact strengths that differed by 10 to 20 percent over the energy range, and at a given momentum the heavier impactor left the smaller damage area. Mass and velocity define the load case.
How is composite impact usually simulated, and where does it fail?
The practical route is a ply-by-ply explicit model: shell layers with a Chang-Chang, Hashin, Puck-type or continuum damage law, cohesive or tiebreak interfaces for delamination, and element deletion when a ply fails. It reproduces force and energy once its parameters are tuned, and that is where it breaks. Heimbs, Heller and Middendorf varied one choice at a time in an LS-DYNA model of a 24-ply carbon/epoxy plate. Neglecting delamination inflated in-ply damage; each added interface softened bending. Element lengths from 1.5 to 8 mm gave strongly different absorbed energy, and the delamination parameters had to be re-tuned for every mesh. The default contact stiffness had to be reduced, or the impactor went through the plate.
NASA's 2024 summary of its LS-DYNA composite model is as direct: the tabulated failure criteria are not yet mesh objective, and delamination in thin thermoplastic panels at higher impact velocity was underpredicted. A good overlay on one test proves parameters can be tuned, not that the model is right.
How do you model delamination so the mesh does not decide the answer?
Delamination is fracture at an interface, so the mesh must resolve the cohesive zone, the stretch behind the crack tip where the interface still carries traction. Song, Dávila and Rose give its length as lcz = E Gc / τ2 (Hillerborg's form; E the transverse modulus, Gc the critical energy release rate, τ the interface strength). For typical graphite-epoxy it is under a millimetre, and at least three to five cohesive elements are needed across it, which may not be practical in structural analyses. Turon's remedy lowers the interface strength to lengthen the zone.
In an impact that remedy has a price: interface strength also sets the load at which delamination starts, the force drop in the drop-tower record. We size the interface mesh from lcz, lengthen the zone only as far as the measured force drop and footprint tolerate, and fix the mixed-mode law on interface coupons. Ply damage needs a crack-band regularisation, so the energy dissipated per crack area does not change with the mesh. Material-side detail: unidirectional laminates, modelling approaches, modelling scale.
Where do element erosion, mass scaling and rate effects mislead?
Erosion deletes an element when every ply at its integration point has failed, taking its remaining energy capacity and stiffness with it, so mesh size enters twice: in the failure strain and in the material removed per event. Deleo, Wade, Feraboli and Rassaian crushed a carbon/epoxy fabric square tube and segments cut from it, simulating each with LS-DYNA's MAT54. The crash-front softening parameter was the most influential, and it was not a material constant: it changed with each geometry. Their reading is that it stands for the damage length that delamination opens ahead of the front. A parameter that varies with geometry is a calibration, not a prediction, and we label it so.
Mass scaling lifts the stable time increment, which scales as element length over wave speed; thin plies, small elements and stiff interfaces drive it down. But added mass is inertia the plate does not have. We report it per part, keep it away from the impact zone and read it with hourglass and contact energy in a ledger every run must pass; Heimbs and colleagues kept hourglass energy below 1% of the total. General checks are in our article on credible crash models.
Rate and heat act through the matrix, which depends on strain rate, temperature and pressure. At impact rates the process turns adiabatic: plastic work becomes heat with no time to conduct away. Sorini, Chattopadhyay and Goldberg predicted significant thermal softening in the matrix-dominated modes, transverse tension and in-plane shear, of a T700/epoxy unidirectional composite. So we calibrate rate dependence on coupons, couple the temperature rise where the load case is fast enough to need it, and never put one dynamic factor on every strength.
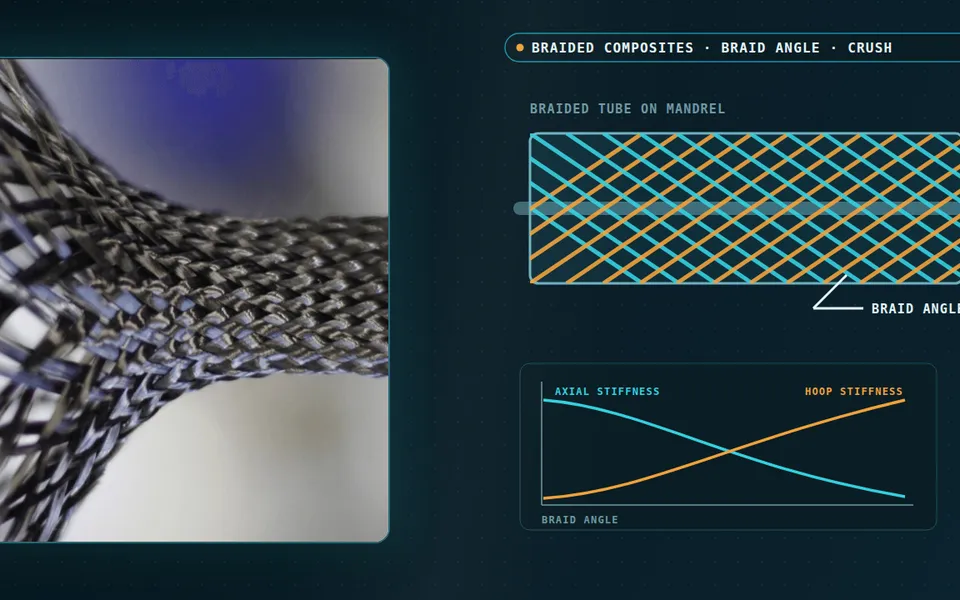
- Plies as shell layers, the interface as its own model. A stacked-shell model gives each ply group a shell layer and puts a cohesive or tiebreak interface between layers, so delamination can open and absorb energy. In an LS-DYNA study of a 24-ply carbon/epoxy plate by Heimbs and colleagues, neglecting delamination in a single shell made the in-ply damage unrealistically large, while each extra interface softened the bending stiffness. The layer count is a calibrated choice.
- The cohesive zone must span several elements. The cohesive zone is the stretch behind the crack tip where the interface still carries traction, the arrows. Its length falls with the square of the interface strength, and for typical carbon/epoxy it is under a millimetre, so the elements must be smaller still. Lowering the strength to lengthen the zone permits a coarser mesh, but it also moves the load at which delamination starts.
- Eroded elements take their energy with them. When every ply at an integration point has failed, the element is deleted, the fading squares, and the energy it could still have absorbed is gone. In the element-size study of Heimbs and colleagues, 1.5 to 8 mm, the absorbed energy changed strongly with the element length, because both the ply failure and the delamination contact depend on it. Failure strains belong to a mesh size.
- The smallest element and the energy ledger. The stable time increment scales with element length over wave speed, so one tiny element or a stiff interface sets the step, and mass scaling is used to lift it. Added mass is inertia the plate does not have, so it is reported, kept small and away from the contact zone, and read next to hourglass and contact energy. Kinetic and internal energy trade places as the hit unfolds.
- Rate and heat act through the matrix. The polymer matrix depends on strain rate, temperature and pressure. At impact rates the conditions turn adiabatic: plastic work becomes heat that cannot conduct away. An Arizona State and NASA Glenn micromechanics study predicted significant thermal softening in the matrix-dominated modes, the dashed curve below the solid isothermal one, and NASA lists rigorous rate and temperature effects as future work for its LS-DYNA composite model.
- Fit on coupons, check on a test the fit never saw. Interface, damage and contact parameters are identified on coupon and element tests, then the model predicts a panel impact it was not tuned on. Element size, layer count, contact stiffness, damping, element type, material properties and interface parameters all influence the result in Heimbs and colleagues' study, so a held-out test, not a good overlay on the fitting data, is the evidence.
How do you simulate crashworthy composite structures?
Crash structures turn the problem around: the aim is controlled, progressive crush. A trigger starts it and the front advances by fibre fracture, fragmentation and splaying while delamination runs ahead. The figure of merit is specific energy absorption (SEA), energy per crushed mass, which Deleo and colleagues put usually between 15 and 100 J/g. It is not a material constant: in their quasi-static tests of a T700/2510 fabric carbon/epoxy tube and segments cut from it, average SEA ranged from 31.6 to 62.3 J/g with section shape, and corner fibre fracture absorbed most of the energy. Validation is therefore needed at section level: corner radius, flange length, trigger.
Vehicle-level and certification questions are in our articles on eVTOL crashworthiness and our crash test simulation page; for explosions on protective structures see blast protection simulation. Blast and projectile loads enter as defined load histories, and we model the protecting structure's response only.
Which composite impact question needs which model?
| Question | Model | Reports | Limit to state |
|---|---|---|---|
| BVID and footprint after a hit? | Ply-by-ply explicit with interfaces | Force history, footprint, dent | Interface parameters, mesh |
| Strength left after impact? | Impact model, then compression step | Residual strength, failure mode | Mapped damage; CAI calibration |
| Does mass matter, or only energy? | Static indentation model, or explicit | Peak force, damage at matched energy | Layup and plate size |
| Does the structure crush progressively? | Continuum damage with trigger | Crush force, SEA | Geometry-specific parameters |
| Do rate or heat change the answer? | Rate-dependent matrix, adiabatic heating | Strength and damage versus rate | Needs high-rate coupons |
| Which layups and energies to test? | Surrogate on designed runs | Force, energy, footprint maps | Sampled range only |
Where does AI help composite impact design, and where does it not?
- Surrogates over layup, thickness and energy. Trained on designed explicit runs and checked on held-out ones, they return peak force, absorbed energy and footprint inside a stated range, with a gate to the full model. See our surrogate modelling page.
- Inverse calibration. Interface, damage and contact parameters are coupled, so we identify them from force histories, C-scan footprints and coupon curves on a surrogate of the model and report the range that fits, not one best point.
- Run screening and scatter. Energy-ledger checks run on every case; ply thickness, fibre content and toughness are sampled through the surrogate, giving ranges (uncertainty quantification).
AI does not supply missing physics: where NASA found delamination underpredicted at higher velocity, a regression on the model's own output inherits the gap. It does not carry a surrogate to a new material, thickness or impactor. Hybrid physics-AI corrections are bounded and logged; see our articles on surrogate models and validating them.
A good overlay is not a damage-tolerance substantiation
From one impact campaign to a workflow your team keeps
The return comes when the next layup, thickness or impactor runs through the same chain.
- Physics model. CFD and FEA set up once, as templates: geometry clean-up, mesh, solver settings and post-processing that every later run reuses.
- Validation. Mesh and time-step studies, and comparison with tests or full-scale data, so the model's uncertainty is known before it is trusted.
- Automated runs. Scripted runs over the parameters and operating conditions that matter, on your hardware or in the cloud.
- AI surrogate. A machine-learning model trained on those runs answers in seconds and says how sure it is; low-confidence questions go back to the solver.
- Decision tool. Optimisation, trade-off charts or operating guidance, in a form your engineers and operators use every day.
- Field data. Test, trial and monitoring data flow back to recalibrate the model, so it improves with every project instead of being rebuilt.
- A parametric impact model in your solver: layup, interface and impactor as parameters, one template recording element type, the mesh rule from the cohesive length and mass-scaling limits.
- A parameter dossier: each parameter with test source, range and sensitivity rank.
- A validation record against your drop-tower force histories, C-scan footprints, dent depths and CAI results, tolerances set beforehand, one case held back.
- Automated runs with an energy-ledger gate and a compression step on the impacted model.
- A surrogate with a stated range and a gate to the full model.
- Handover and training: our training and software development services, after consulting has set the plan.
How credible is a composite impact simulation result?
Verification is convergence and bookkeeping: mesh against cohesive length, time step and mass scaling, the energy ledger. Validation uses your force histories, C-scan footprints at more than one energy and CAI results, one case held back. Uncertainty is sampled: ply thickness, fibre content, toughness, rate terms. The answer is a range with ranked contributors.
Composite impact simulation questions
What is barely visible impact damage (BVID)?
Why does compression after impact drive composite design?
LS-DYNA or Abaqus/Explicit for composite impact?
Can I use mass scaling in a composite impact model?
Does simulation replace impact and CAI testing?
If a layup release, a repair threshold or a crash-structure design freeze is waiting on impact and CAI results, send us the layup and materials, the impactor mass, shape and energies (or the crush load case), your force histories and C-scan or CAI results, and the model you use today. We reply with the model set we would build, the calibration and validation plan, and what a surrogate could cover. Start with a conversation, or see our impact and crash page.