Discontinuous fiber composite simulation for compression-moulded prepreg chip parts
The part is stiff on average and scatters at the weld line, and cracks between chips appear before any load. Chip flow, orientation mapping, cure stress and random-chip models show where, and what to change.
Discontinuous fiber composite simulation predicts how prepreg chips flow, orient and cure in a compression mould, then carries that orientation, residual stress and scatter into the structural model of the part. We build it as a repeatable chain around your existing solvers, with a validation record and a surrogate of stated range, so tool trials and component tests answer sharper questions.
The bracket leaves the press looking right: coupon averages match the datasheet and it must replace a machined metal part at a fraction of the mass. Then parts that look identical are loaded to failure; one tears gradually, another snaps at a weld line. Stelzer and colleagues (Composites Part B, 2022) report that pattern in hat sections moulded from prepreg chips. A University of Washington review calls certification of load-bearing discontinuous fiber aircraft parts “point design”, testing many individual parts, and sets analysis supported by testing as its goal.
What makes discontinuous fiber composite simulation harder than a laminate?
The unit of structure is the chip. Stelzer and colleagues moulded unidirectional prepreg cut into platelets of nominal 50 mm by 8 mm, about 0.15 mm thick once cured, at 57 vol% fiber. Favaloro, Sommer and Pipes count three scales: part, platelet and fiber. Failure is matrix-dominated, usually starts at chip ends and resin pockets and spreads over many small damage sites: pseudo-ductile response and scatter together.
The scatter is partly a size effect. In ASTM D3039 tension coupons the same authors found standard deviations up to 11.2% on modulus and 24.0% on strength. Strength rose from about 263 ± 63 MPa at 2.1 mm thickness to 343 ± 22 MPa at 7.8 mm as more chips averaged out; modulus did not change. A coupon narrower than the chip is not a representative volume.
Orientation is summarised by the tensor aij = ⟨pipj⟩, the average over fiber directions p, with trace one: planar random chips give axx and ayy near ½, azz near zero. Stelzer and colleagues measured that state at both coverages, yet higher flow lowered component stiffness and peak load, which their scans link to waviness and defects. The tensor is necessary, not sufficient.
How does chip flow simulation map orientation into the structural model?
The flow model must treat chips as discrete platelets, because a smooth orientation field fails in thin sections. Favaloro, Sommer and Pipes model each as a nearly incompressible, transversely isotropic fluid, its viscosity ratio Rη = η11/η22 related to the aspect ratio squared, and rotate fiber direction p and platelet normal r affinely, ṗ = W·p + ξ(D·p − (D:pp)p), ξ = 1 for p and −1 for r: Jeffery’s equation. They solve it by smoothed particle hydrodynamics in Abaqus/Explicit and map the result onto a structural mesh, checked against a CT scan.
How far to trust it is a validation question. Qian and colleagues note that confidence in process models stays low for lack of validation data. In a plaque test, two commercial packages, one with a Folgar–Tucker orientation field, one tracking individual tows, over-predicted flow-direction alignment by up to 27% and 20% away from the edges and missed ply-edge and part-edge effects. Their earlier assessment found flow patterns right only for one-dimensional flow.
So we treat the process model as a calibrated instrument: viscosity ratio and wall slip as ranges, fitted to CT-derived orientation with one charge pattern held back. The hand-over carries platelet normal, chip count, waviness and a weld flag as well as the tensor. Our scale-choice article covers the wider scale question.
- Coverage sets how far chips must flow. The bracket shows the share of the cavity the charge covers: a smaller share means longer flow. Stelzer and colleagues moulded one hat section at 80% and 60% coverage as low-flow and high-flow set-ups.
- Chips rotate with the flow. Each chip is a stiff platelet in a viscous matrix. The fading pairs show random chips lining up as the charge spreads: an affine, Jeffery-type rotation of the fiber direction under an anisotropic viscosity.
- Fronts meet at a weld line. Where two flow fronts collide, the amber dashed line and its cracks mark the weakest place. Stelzer and colleagues found cracks separating platelets along their fibers there and a major strength loss.
- Waviness and voids ride along. Flow bends chips and traps voids, the wavy lines and open circles. In the same study higher flow lowered stiffness and peak load, which the authors trace to waviness and defects, not to alignment.
- The mesh gets more than a tensor. Every element receives an orientation ellipse, the platelet normal, the chip count through the thickness and a weld flag, in a versioned file. A tensor alone hides waviness and weld lines.
- CT closes the loop. Orientation from a CT scan of a moulded part is compared with the prediction and the few flow parameters are recalibrated. Qian and colleagues found gaps at ply edges and part edges that process models missed.
Why do cracks open between chips during cure, and how are they simulated?
Our discontinuous fiber composites page names the problem: with a poorly controlled cure cycle, thermal stresses build between adjacent chips. The physics is mismatch. Along its fibers a carbon chip barely changes length with temperature; across them the resin dominates. Bonded neighbours at different angles must strain together, so each shrinkage and cool-down loads interfaces at chip ends and resin pockets. Limaye and colleagues list the laminate sources, among them thermal-expansion mismatch at fiber-resin and ply-to-ply level, cure shrinkage and the through-thickness gradient.
The model has two stages. A thermo-chemical step solves ρcp∂T/∂t = ∇·(k∇T) + (dα/dt)(1 − Vf)ρrHr, α the degree of cure; a stress step follows, as Limaye and colleagues couple them in Abaqus. The resin law decides the answer: elastic gives cool-down stress only, viscoelastic gives the history but needs extensive characterisation, and cure-hardening instantaneous linear-elastic (CHILE) models trade fidelity for cost. For chips, the part-scale cure model hands temperature and cure histories to a chip-scale submodel with orthotropic chips and cohesive interfaces, checked against transverse and interface strength.
A thermoplastic matrix changes the history, not the need. Eguémann and colleagues consolidated carbon/PEEK chopped tape above the 345 °C melting temperature of PEEK under 100 bar and cooled it below the 140 °C glass transition: the stress history is the cool-down, not a cure. Tougher matrices are often expected to cope better; we test that for your system. In that study 20 mm chips scattered more than 10 mm chips.
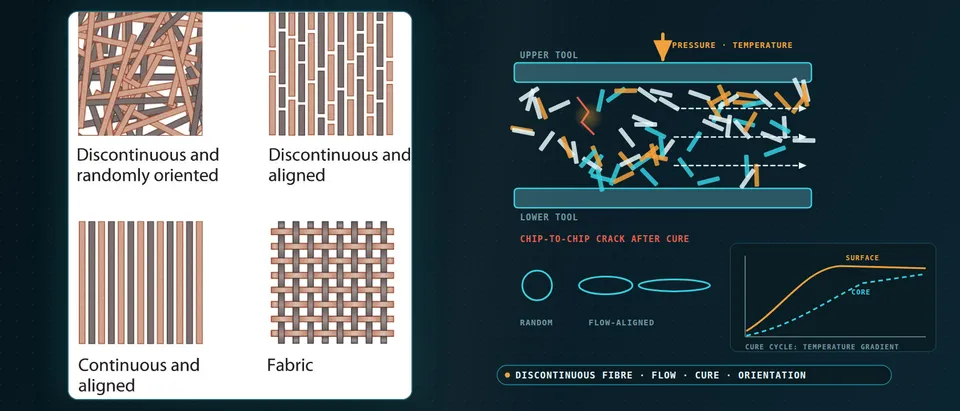
- Surface leads, core lags. Heat enters from both tools, so the surface, the solid curve, gels before the core, the dashed curve, which can overshoot on reaction heat. The timing difference freezes in a stress gradient.
- Neighbouring chips pull against each other. Along its fibers a carbon chip barely changes length; across them it contracts strongly, the short and long arrows. Bonded chips at different angles strain against each other as the stack shrinks and cools.
- Stress peaks at chip ends. Chip ends and resin-rich pockets concentrate the mismatch and the crack opens along the chip boundary. Stelzer and colleagues describe failure starting at chip ends and resin pockets; the cure model supplies the starting stress.
- Thermoset and thermoplastic histories differ. A thermoset history adds reaction heat and chemical shrinkage during the hold. A thermoplastic one is melted, held under pressure and cooled through its glass transition, so cooling rate sets the stress.
- A surrogate searches the cycle inside a stated range. Sampled cure-model runs train a surrogate that searches hold temperature and time for the least stress while full cure holds. Points outside the dashed range go back to the full model.
What does a random-chip model add, and where does it fail?
The stochastic laminate analogy, credited in the Washington review to Feraboli and Ciccu, splits the part into random laminate volume elements, each with its own random chip stacking sequence, and repeats the analysis to reproduce scatter. Element size, about 19 mm, was set by matching modulus scatter to digital image correlation. The weak point is the final-fracture rule: all chips failed in one element was too conservative, and a global stiffness-loss rule took 41 to 49 hours per analysis on a 181-element aircraft part against about 5 to 21 hours, with dozens to hundreds of runs needed.
Chip-resolved models sit at the other end. Kravchenko, Sommer and Pipes model aligned, staggered platelets in a periodic Abaqus/Standard cell: orthotropic shells with anisotropic damage, 5 µm cohesive layers in the overlaps. The platelet length-to-thickness ratio sets the failure mode: at a critical ratio strength peaks and platelets rupture; below it interface damage and delamination limit strength; scatter falls as the ratio rises. Real parts are random, so this bounds the physics. We set up both: the cheap model for sweeps, the chip-resolved one to calibrate it.
Which question needs which model?
| Question | Model | Reports | Limit to state |
|---|---|---|---|
| Where do fronts meet? | Platelet-level flow model | Front history, weld-line map | Reliable mainly in simple flows |
| What orientation does each region carry? | Flow model mapped to the structural mesh, CT check | Tensor, platelet normal, chip count | Edge effects; waviness needs CT |
| Is the part stiff enough? | Mapped orientation or random laminate elements | Deflection with scatter band | Thin walls hold few chips |
| Could chips crack in cure? | Cure model, chip-scale submodel | Cure history, interface stress | Needs kinetics and resin law |
| How much does strength scatter? | Random-chip Monte Carlo; chip-resolved cell | Peak-load distribution, failure mode | Fracture rule is a choice |
| Which charge, rib and cycle? | Surrogate on designed runs, gated | Stiffness, mass, flow, stress maps | Sampled range only |
A mapped orientation is not an allowable
Where does AI help discontinuous fiber composite design, and where does it not?
- Surrogates over the stochastic analysis. Trained on designed runs, with coverage, placement, chip count and weld flags in and the stiffness and peak-load distribution and a failure-mode class out, inside a stated range. Rib and wall layouts for mass are optimised over it, the flow model as manufacturability constraint: a rib the charge cannot fill saves no weight. See our generative design and optimisation page.
- Cure-cycle search. Limaye and colleagues replaced a genetic algorithm with constrained Bayesian optimisation on a Gaussian-process surrogate for two laminate cure cases, minimising distortion with degree of cure at or above 0.96: more than 1,000 convergence steps against fewer than 50, agreeing within 4%. That was laminates; we aim it at inter-chip stress and verify the optimum on the chip-scale model.
- Calibration. Bayesian calibration puts ranges, not points, for viscosity ratio, wall slip and interface strength into the model.
AI does not repair a flow model that puts the front in the wrong place or invent weld-line behaviour absent from its training runs. Stelzer and colleagues saw failure switch from pseudo-ductile to brittle as flow and weld lines changed; a surrogate trained only on low-flow set-ups would cross that silently. Ours output the failure-mode class, sample both sides and gate outside-range cases to the full model. See our surrogate modelling, hybrid physics-AI and uncertainty quantification pages and surrogate models and validating them in the blog.
From one part study to a workflow your team keeps
- Physics model. CFD and FEA set up once, as templates: geometry clean-up, mesh, solver settings and post-processing that every later run reuses.
- Validation. Mesh and time-step studies, and comparison with tests or full-scale data, so the model's uncertainty is known before it is trusted.
- Automated runs. Scripted runs over the parameters and operating conditions that matter, on your hardware or in the cloud.
- AI surrogate. A machine-learning model trained on those runs answers in seconds and says how sure it is; low-confidence questions go back to the solver.
- Decision tool. Optimisation, trade-off charts or operating guidance, in a form your engineers and operators use every day.
- Field data. Test, trial and monitoring data flow back to recalibrate the model, so it improves with every project instead of being rebuilt.
- A parametric press model in your existing solver: coverage, placement, tool temperature and closing speed as parameters, choices recorded.
- An orientation hand-over contract: tensor, platelet normal, chip count, waviness and weld flag per element, in a versioned, tested file.
- A cure and cool-down template, each parameter with source and range.
- A random-chip sampler with fixed seeds and run-count convergence checks.
- A validation record: a coupon thickness series, CT orientation and a component test, tolerances set before the run.
- A surrogate with a stated range and a gate to the full models.
- Handover and training, so your team runs and extends it: our training and software development services.
How credible is a chip-moulding simulation result?
Verification is convergence: particle count, element and cohesive size, volume-element size and random draws until the scatter band stops moving. Validation follows the building-block logic: a coupon thickness series, CT orientation, then component tests comparing failure mode as well as load. Uncertainty is sampled: charge placement, flow and interface parameters, resin law, material scatter. The answer is a distribution with ranked contributors.
Questions engineers ask about discontinuous fiber composite simulation
What is a discontinuous fiber composite?
Can I use the datasheet modulus in a shell model?
Does more material flow improve properties by aligning fibers?
Why simulate cure if the press cycle is already set?
Does simulation replace component tests?
If a metal-replacement part, a weld-line failure or a cure-cycle question is waiting on this, send us the geometry, load cases and mass target, the chip system and its cycle, the charge pattern and press settings, and any coupon data or CT scans. We reply with the model chain we would set up, the validation we would run and what a surrogate could cover. Start with a conversation, or see our discontinuous fiber composites page.