Spray dryer CFD for droplet drying, wall deposition and powder quality
The second batch loses yield and powder cakes on the roof, but the bench trial ran at one outlet temperature. Euler-Lagrange CFD with a droplet-drying law fitted to your feed, checked against the dryer's energy balance, ranks nozzle, tower and gas-flow changes before the next pilot run.
Spray dryer CFD predicts where each droplet goes, how fast it dries and what state it is in when it reaches a wall or the cyclone, so a nozzle, tower or air-flow change can be compared before the next pilot run or revamp. It pairs a turbulent gas model with Lagrangian droplets and a drying law fitted to your feed, and it earns trust only when it closes the dryer's energy balance and reproduces its deposit pattern. We set that chain up around your existing solver.
The first batch runs well, the second loses yield, and the roof is coated with powder. Sundararajan and colleagues (2023) describe this on a pharmaceutical dryer: an inline particle analyser disturbed the gas flow and pushed partly dried particles to the roof, and start-up and shutdown held the deposit near its glass-transition onset and lowered that temperature, so the next batch built on it. A scale-up, a feed-rate increase or a nozzle change that a bench result cannot settle hangs on the same details.
What does spray dryer CFD resolve, from atomiser to cyclone?
The gas is a swirling, turbulent flow with recirculation; the droplets are a second phase, too dilute to resolve one by one and too important to ignore. The usual choice is Euler–Lagrange (see our multiphase numerical methods): a Reynolds-averaged or scale-resolving gas flow, droplet parcels with a drag law and turbulent dispersion, and two-way momentum, heat and vapour sources. The review by Wahab and colleagues (2025) states that turbulence model, steady or transient solution and 2D or 3D domain shift residence times and recirculation, and quotes maximum discrete-phase errors approaching 20%.
The flight is short, ca. 2–4 s from droplet to particle by the same review, so residence-time distribution matters: a droplet that short-circuits the core and one held in a recirculation zone have different histories, and the powder follows the history. We report residence time, particle temperature and moisture at every wall hit and the outlet, and state what was validated, as direct validation of residence time is scarce.
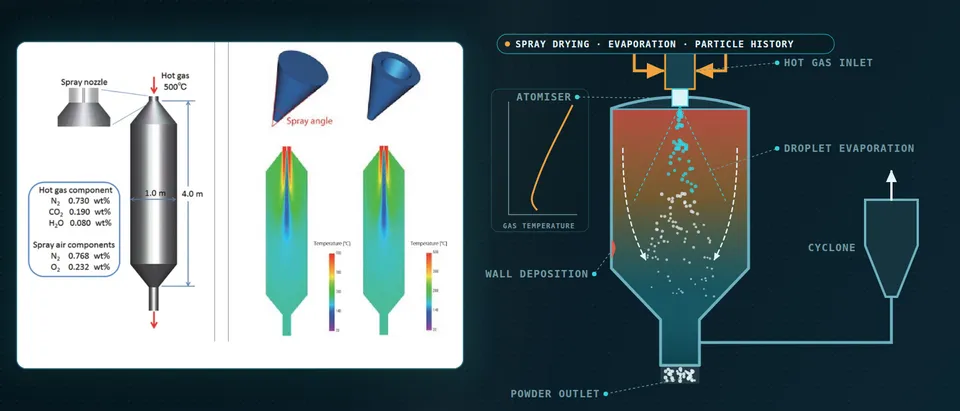
- Atomiser and spray cone. The nozzle hands the model a droplet size distribution, a speed and a cone angle. A viscous feed atomises differently from the water used in a bench test, and a wider cone (dashed) reaches the walls sooner, so these are measured on the real feed and swept, not fixed.
- Hot gas, swirl and recirculation. The gas disperser sets a swirling, turbulent flow with recirculation near the walls. The turbulence model, a steady or transient solution and a 2D or 3D domain move each droplet's residence time and where it meets a wall.
- Droplets cool the gas they dry in. Each droplet trades momentum, heat and vapour with the gas around it. While it evaporates it stays near the wet-bulb temperature and draws heat from the gas, so the temperature field is a result of the two-way coupling, not an input.
- One droplet, from wet to particle. Solvent leaves at a rate set by heat transfer until solute piles up at the surface and a skin forms, the locking point. The rate then falls and the particle heats toward the gas temperature. A drying law fitted to a single-droplet experiment carries this to every parcel; the Péclet number ranks hollow against dense.
- Gas temperature along the tower. The gas cools fastest where most solvent evaporates, near the atomiser, and settles toward the outlet. The outlet temperature also closes an energy balance: evaporation duty and wall heat loss are paid for by the drying gas, so a result that misses it is wrong at every height.
- Cyclone and outlet. Powder and gas leave together. Centrifugal force grows with the cube of particle diameter and Stokes drag only with the diameter, so the smallest particles escape with the exhaust. Size classes tracked to the cyclone inlet give the fines to catch; the exhaust state sets the energy bill.
How do you model droplet drying, and where does each model fail?
A droplet dries in two stages. It first sits near the wet-bulb temperature and loses solvent at a rate set by heat transfer from the gas, with Ranz–Marshall-type correlations. When solute piles up at the surface a skin forms, the locking point; the rate falls and the particle heats toward the gas temperature. Boel and colleagues (2020) sort the models into distributed-parameter models resolving crust and segregation, the characteristic drying-rate curve and the reaction engineering approach.
That last treats evaporation as an activation process: pv,s = ψ pv,sat(Ts), ψ = exp(−ΔEv/(R Ts)), with ΔEv rising as the surface dries, fitted to a single-droplet experiment. The characteristic curve needs a critical moisture content measured per drying condition. Where studies compared both, the review reports the reaction engineering approach more reliable at high feed concentration and humidity. Distributed models cost most to calibrate; lumped ones suit every parcel. None replaces a measured drying curve of your feed.
The locking point sets the particle. The review gives Pe = ddJ/Di, evaporative flux against solute diffusion: low Pe leaves a dense sphere, high Pe an early skin and hollow or wrinkled particles. For a dense sphere that neither fragments nor coalesces, dp = (ci/ρp)1/3dd, ci the feed solute concentration and ρp the particle density. We use Pe to rank designs.
Why does the atomiser decide the answer?
Everything above starts from a droplet size distribution, speed and cone angle at the nozzle, and a distribution measured on water is not the feed's. Welch and colleagues (2024) imaged a 3D-printed adaptation of a commercial two-fluid spray-dryer nozzle with a 20% w/w copovidone solution: unlike water, breakup was governed by viscosity rather than surface tension, with stringy filaments and larger droplets. We ask for atomisation data on the real feed and gas-to-liquid ratio, fit size distribution and cone angle to it, and sweep both, since the Wahab review lists initial atomisation parameters among the error sources. See our spray simulation page.
Why does powder stick, and how far can CFD predict it?
A particle sticks when its surface is rubbery rather than glassy. Moisture lowers the glass-transition temperature Tg of an amorphous product, so a particle still wet and warm at the wall is sticky and a dry one bounces. Milanesi and colleagues (2022) give the common guidance that the outlet air sit 10 °C below the Tg of the droplet's surface layer. Sundararajan and colleagues show one margin is not enough: some powders adhered strongly even below Tg, near its wet onset, and a deposit exposed to warm, solvent-laden gas at start-up or shutdown lost Tg and caught more powder next batch.
What we compute is state at impact: each parcel reaching a wall carries temperature, moisture and Tg, so we map where partly dried particles arrive and with what margin, in production and in start-up and shutdown transients that a steady run cannot see, calibrated on your deposits. That ranks spray angle, inlet geometry and outlet temperature. It is not a deposition rate; the same authors call predictive models of wall deposition very difficult.
Stickiness is sometimes the aim. De Leeuw and colleagues (2026) note that sticking collisions between drying droplets and fines returned from the cyclone or fluidised bed help give spray-dried powders their quality; for maltodextrin droplets they occurred at collision times of 0.75 to 1.5 times the locking-point time. One run then shows where agglomeration helps and where it becomes deposit. Deposits are also a combustible-powder question for your process-safety team (our dust explosion venting article).
- Surface Tg climbs as the droplet dries. Moisture plasticises an amorphous product, so the glass-transition temperature of the surface layer is low while the droplet is wet and rises as solvent leaves. The curve has to come from moisture-Tg data measured on the actual feed.
- Particle temperature. The particle sits near the wet-bulb temperature while it dries, then heats toward the gas. Its history, from the coupled gas and droplet model, is what is compared with the glass transition, not the gas temperature alone.
- The sticky window. While the surface is above its glass transition, or too close to it, contact adheres: wet droplets merge, partly dried ones stick, and once the skin turns glassy particles bounce. A warmer or more humid gas (dashed) delays the crossing and stretches the window along the tower.
- State at wall impact. Every parcel that reaches a wall carries its temperature, moisture and Tg. A partly dried particle that lands inside the window sticks; a glassy one rebounds and is carried on. The map ranks risk and is calibrated on your deposits; it is not a deposition rate.
- Where spray and swirl reach the wall. A wide cone, an inlet that throws the swirl at the roof or a disturbed gas flow carry partly dried particles to the roof and upper wall, where the deposit grows layer on layer. Cone angle and inlet geometry are the cheap variables to sweep.
- Start-up and shutdown memory. A deposit left from one batch is warmed and exposed to solvent vapour at shutdown and start-up. That lowers its own glass transition, so it catches more powder in the next batch. A steady production run cannot show this; a transient run of the sequence can.
Does the dryer close its energy balance?
In steady state the drying gas pays for evaporation and wall heat loss: Tout = Tin − (Qfeed + Qloss)/(cpGin), Qfeed being the heat to warm the feed to wet-bulb and evaporate the solvent. Outlet temperature then sets exhaust loss, moisture and stickiness margin: one number links energy, quality and deposits.
Milanesi and colleagues tested this on a laboratory glass-tower dryer: a 3.8-million-cell Eulerian three-phase CFD model, with Lee evaporation and no droplet size, against a thermodynamic balance whose wall temperature came from a random forest fitted to a 74-point dataset. For outlet temperature while atomising, mean absolute error was 10.43 K for the CFD and 1.74 K for the balance, and CFD error grew with outlet temperature and feed rate. The authors note the balance was tuned to the data and the CFD was not, and that in this dryer wall heat loss mattered as much as the evaporation duty.
The cyclone closes the loop: centrifugal force grows with d3, Stokes drag with d, so the smallest particles escape with the exhaust. Tracking size classes to the cyclone inlet gives the fines it must catch, and a cyclone model its pressure-drop cost; yield loses wall deposit and cyclone escape alike.
Which spray dryer question needs which model?
| Question | Model | What it reports | Limit to state |
|---|---|---|---|
| Gas flow, residence time | Gas phase with Lagrangian droplets | Temperature, humidity, residence time | Check profiles, not only the outlet |
| Drying of one feed | Single-droplet law fitted to droplet data | Drying time, locking point, particle state | Fitted range only |
| Particle size, shape | Solute balance, Péclet indicator | Size class, hollow or dense | A ranking |
| Wall deposition | State at impact against Tg, transients | Where, and with what margin | Risk map, not a rate |
| Agglomeration | Collision model on the locking point | Size growth, sticky zone | Needs collision data |
| Outlet temperature, energy | Energy balance, measured heat loss, then CFD | Outlet temperature, duty, loss | The balance is the gate |
| Cyclone loss | Size classes at inlet, cyclone model | Escape by size, pressure drop | Needs fines distribution |
| Nozzle, tower variants | Surrogate on designed CFD runs | Screening of angle, temperature, feed | Sampled range only |
A deposit map is an estimate, not a guarantee
Where does AI help spray dryer design, and where does it not?
- Nozzle and tower screening. The Wahab review describes CFD-generated datasets training a model, and cites CFD droplet-size datasets over nozzles and spray angles feeding a mechanistic model of a sticky material. A surrogate over spray angle, inlet temperature, feed rate and gas flow screens thousands of cases.
- Closures from plant data. Milanesi and colleagues used a random forest for the wall temperature their balance needed: RMSE 10.90 K (R2 0.69), outlet temperature still within a mean 1.74 K. We fit heat-loss and impact-criterion closures to your logs.
- A drift gate. Outlet temperature and moisture are compared with the model each campaign; a departure flags a changed feed, nozzle wear or heat loss.
It does not measure a drying curve, a Tg curve or a spray, and does not extrapolate: the review warns that machine-learning models need high-quality data and may fail on a new formulation. See surrogate models for CFD and FEA and our surrogate modelling, hybrid physics–AI and uncertainty quantification pages.
From one dryer study to a spray-drying workflow you keep
The return comes when your engineers can put the next feed, nozzle or tower through the same chain.
- Physics model. CFD and FEA set up once, as templates: geometry clean-up, mesh, solver settings and post-processing that every later run reuses.
- Validation. Mesh and time-step studies, and comparison with tests or full-scale data, so the model's uncertainty is known before it is trusted.
- Automated runs. Scripted runs over the parameters and operating conditions that matter, on your hardware or in the cloud.
- AI surrogate. A machine-learning model trained on those runs answers in seconds and says how sure it is; low-confidence questions go back to the solver.
- Decision tool. Optimisation, trade-off charts or operating guidance, in a form your engineers and operators use every day.
- Field data. Test, trial and monitoring data flow back to recalibrate the model, so it improves with every project instead of being rebuilt.
- A parametric tower model in your existing solver: tower, disperser, nozzle and cyclone as parameters, one template recording turbulence, mesh, parcel count and time step.
- A feed pack from your measurements: viscosity, Tg against moisture and a single-droplet drying curve, with the fitted law and its range.
- A spray library of size distribution and cone angle per nozzle, feed and gas-to-liquid ratio, from your atomisation data.
- An energy-balance gate on outlet temperature and wall heat loss.
- A deposit and fines post-processor: particle state at wall and cyclone inlet.
- A validation record with tolerances set before the run. ASME V&V 20-2009 (R2021) quantifies accuracy at specified validation points and leaves extrapolation to engineering judgment, so we state the range.
- A surrogate with a stated range and a gate to the full model outside it.
- Handover and training, so your team runs and extends it: training and software development.
Questions engineers ask about spray dryer CFD
Which CFD model suits a spray dryer?
Can CFD predict wall deposition?
How accurate is spray dryer CFD?
Can CFD replace pilot trials?
If a pilot run, scale-up or nozzle change is waiting on a spray dryer answer, send us the tower, nozzle and cyclone drawings, the operating window, the feed's solids, viscosity, glass-transition and drying data, any spray or particle-size measurements, and photographs or logs of deposits and yield. We reply with the model chain we would set up for each question, its validation record and what a surrogate could cover. Start with a conversation, or read our multiphase simulation page or consulting service.