Composite delamination simulation for UD laminates with ply damage and cohesive zones
The stacking sequence changes, a ply drop moves, and last year's notched-strength matrix no longer applies. Ply-level damage, cohesive interfaces and XFEM, with mesh rules, coupon calibration and validation, show which mechanism sets the failure and what the test programme must still settle.
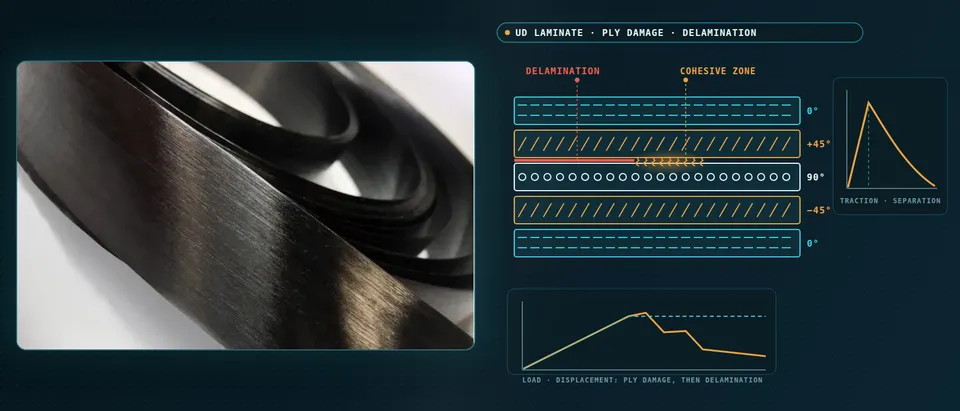
Composite delamination simulation predicts where the plies of a unidirectional laminate crack, where its interfaces open and how the load falls afterwards, by pairing ply-level damage with cohesive interfaces or XFEM. We build that pairing as a repeatable workflow around your own solver, with mesh rules, a validation record and a surrogate of stated range, so more layup and ply-drop questions are answered before the next test campaign.
The design review wants a new stacking sequence, a ply drop moved by a bay, and the old notched-strength matrix does not carry over. Camanho, Maimí and Dávila describe a design process that otherwise rests on costly matrices of coupon tests and empirical knockdown factors; Song, Li and Rose note that notched-strength models need their parameters redetermined for each material system and stacking sequence. Block the plies and the failure itself changes: in their tests with a 1/8-inch hole on (45m/90m/−45m/0m)s laminates the mode moved from pull-out at m = 1 to delamination at m = 2 and 4. Test dates wait on a few specimens.
What does composite delamination simulation have to capture in a UD laminate?
Fibre tension is brittle and sets the ultimate load, fibre compression ends in kinking, matrix cracks and splits form inside plies, and delamination opens between them in mixed mode, peel and shear together. Hofman, van der Meer and Sluys name stacking sequence, laminate thickness and notches as what decides the final failure mode.
Ply thickness enters through the in-situ effect: a ply held between neighbours of other orientations cracks at a higher transverse tensile and shear stress than in a unidirectional coupon. Dávila and Camanho (NASA/TM-2003-212663) give the in-situ strength of a thin ply as inversely proportional to the square root of its thickness, and thickness-independent for a thick cluster, with the transition at about 0.7 mm, five or six plies, for carbon/epoxy and E-glass/epoxy, after Dvorak and Laws.
Delamination is a toughness and a strength problem in one interface. A cohesive law gives it a traction-separation response whose area is the toughness Gc, and its process zone has length lcz = M E2 Gc / τ02, with E2 the transverse modulus and τ0 the interface strength. Turon and colleagues tabulate published models: M runs from 0.21 to 1, so your mesh rule depends on the model chosen. For typical carbon/epoxy the zone is under a millimetre or two.
- The interface is a spring that softens. A cohesive law gives the interface a traction that rises with separation to a peak, the interface strength, and then falls to zero as the surfaces part. The area under the curve is the fracture toughness, so energy is spent as the front advances. The dashed stems show the traction ahead of the crack tip that pulls the arms together.
- The process zone has a length. The distance from the crack tip to the peak traction, the bracket, scales with the transverse modulus times the toughness over the strength squared, times a factor that depends on which published cohesive-zone model you follow. For carbon/epoxy it is short, often shorter than the elements a structural model can afford.
- Count the elements across it. The mesh alternates between a coarse and a fine row. With too few elements across the zone the dissipated energy is misrepresented and the load is over-predicted; three or more is the working minimum. The chain at the bottom is the mesh rule we automate: toughness, strength and modulus give the zone length, the element length gives the count, and every run is checked against it.
- Lower strength lengthens the zone. Both curves enclose the same area, so the toughness is unchanged; the dashed one peaks lower and softens over a longer separation, which stretches the process zone over more elements of a coarse mesh. The price is that the onset stress is no longer the true strength, so onset predictions are checked with and without the reduction.
- Mode mixity moves the toughness. A delamination that turns from a ply into an interface opens in peel and shear together. The Benzeggagh-Kenane form blends the mode I and mode II toughness with an exponent, eta, fitted from mixed-mode tests. How the solver takes that law as input changes the answer, so it is verified against analytical and crack-closure benchmarks.
- Check the numerics, not only the curve. Softening is hard for implicit solvers and viscous or stabilisation damping is the usual remedy. The bar shows its slice of the total internal energy: the slice must stay small and the load history must not change with displacement rate or increment size, or the damping rather than the material is making the prediction.
Ply damage, cohesive zones or XFEM: what does each get wrong?
Ply-level continuum damage pairs Hashin-, Puck- or LaRC-type initiation with an energy-based evolution law per mode. LaRC03 finds the matrix fracture plane by maximising Mohr-Coulomb effective stress, models kinking from fibre misalignment and takes in-situ strengths from fracture mechanics. The traps are in the mesh. Camanho and colleagues show peak load and dissipated energy shifting with refinement unless the post-peak slope is scaled with element length, so each element dissipates the measured fracture energy. Song, Li and Rose find crack paths need element edges aligned with the fibres: a radial mesh missed the delamination mode of their open-hole laminates, while per-ply aligned meshes with tied cohesive layers caught it.
Cohesive interfaces carry delamination but need three or more elements across the process zone, though Turon notes published minima run from two to over ten. His remedy lowers the interface strength so the zone spans enough elements of a coarse mesh at unchanged toughness; it worked for a double cantilever beam and for a [+25/−25/90]s free-edge laminate, where lcz was 0.361 mm. At nominal strength, meshes coarser than 0.1 mm over-predicted the load there and above 0.5 mm the peak was over twice the converged value. Turon cautions that stresses near the crack tip may change, so we check onset with and without the reduction. Mixed mode needs a Benzeggagh-Kenane exponent from mixed-mode tests; NASA's Advanced Composites Consortium benchmarks DCB, end-notched-flexure and single-leg-bend cases against analytical and crack-closure references (Justusson and colleagues, AIAA SciTech 2021).
XFEM and phantom- or floating-node formulations let a matrix crack start where the stress says, without remeshing or pre-placed interface elements. Hofman and colleagues note that phantom-node XFEM gives mesh-independent matrix cracks and that a floating-node model predicted the failure sequence of notched and unnotched laminates with many cracks interacting with delaminations. We use it where crack patterns, not strength alone, are the answer.
Which UD laminate question needs which model?
| Question | Model | Reports | Limit to state |
|---|---|---|---|
| Where does matrix cracking start? | Failure criteria with in-situ strengths | Failure index per mode | No post-peak response |
| Notched strength and size effect? | Ply-level damage, regularised, aligned mesh | Load-displacement, damage by mode | Mesh orientation, element length |
| How far does a known delamination grow? | Cohesive interface, mixed-mode law | Load against crack length | Elements in zone, exponent from tests |
| Does delamination start at a free edge or ply drop? | Cohesive interface, refined local model | Onset load, link-up | Strength matters |
| How do matrix cracks and delamination interact? | XFEM or floating-node cracks plus interfaces | Crack pattern, failure sequence | Insertion rule, run cost |
| Which stacking sequence or ply drop to test? | Surrogate on designed runs | Strength and stiffness map | Sampled range only |
Why do ply thickness and hole size change the strength?
In Camanho and colleagues' IM7-8552 tests the strength fell with hole size, because non-critical damage forms before collapse and is large against a small hole. A maximum-stress fibre criterion cannot see it and was 49.1% low for a 2 mm hole; fracture mechanics calibrated at 6 mm tracked 6 to 10 mm holes but failed at 2 mm and below. A ply-level damage model with measured ply properties and fracture energies predicted the size effect well.
Blocking reverses the trend: Camanho and colleagues report, from tests by Green and colleagues, strength rising with hole size in blocked laminates, as delaminations at the hole edge take over. Song, Li and Rose's aligned-mesh model reproduced that inverse hole-size effect and the delamination mode at m = 4, but called the m = 2 laminate a pull-out failure where the test showed delamination, and it over-predicted failure load for delamination-dominated specimens while under-predicting pull-out. We therefore report error per failure mode.
- Thin plies resist matrix cracking. A ply held between neighbours of other orientations cracks at a higher transverse tensile and shear stress than the same ply in a unidirectional coupon, the in-situ effect. For thin plies the strength rises as the clustered thickness falls and beyond a transition it levels out. Failure criteria need the in-situ strength of each ply cluster, not one unidirectional value.
- The mesh must follow the fibres. A matrix crack runs along the fibre direction. On a mesh that crosses it the damage smears over a stair-step of elements and the stress transfer across the crack is wrong. With element edges along the fibres, and cohesive layers tied between the plies, the crack opens where it should.
- Splits and delaminations link up. Splits in the surface ply and diagonal cracks in the off-axis plies meet through delamination, the amber lobes. Delamination relieves the stress at the hole and delays fibre failure, then drives the collapse when the lobes join, so a ply-level damage model needs interfaces to give a notched strength. Blocked plies, which form thicker clusters, favour delamination-dominated failure.
- Fibre failure ends the load. Fibre tension is brittle and occurs on the net section beside the hole. Its fracture energy, and the kinking that governs compression, are measured rather than assumed, and the criteria that capture them are separate from the matrix criteria.
- Softening is scaled by element size. The energy a softening element dissipates per unit crack area is its length times the area under its stress-strain curve. Scaling the post-peak slope with element length keeps that energy equal to the measured fracture energy, so the coarse element, dashed, softens more steeply than the fine one. Without it the peak load and the dissipated energy change with every refinement.
- Hole size changes the strength. Non-critical damage forms a zone of roughly fixed size at the hole edge. On a small hole it spans the ligament; on a large hole it is small by comparison and the strength approaches a limit. Strength-of-materials criteria cannot see this, and fracture-mechanics scaling holds only over a range of sizes.
How do you calibrate and validate a UD model from coupons?
Camanho and colleagues measured ply stiffnesses and strengths in tension, compression and ±45° shear to ASTM D 3039, D 3410 and D 3518, and fibre fracture energies in compact tension and compression. Mode I toughness comes from a double cantilever beam test, ASTM D 5528; mode II and the mixed-mode exponent from end-notched-flexure and mixed-mode tests. Open-hole tension, ASTM D 5766 there, stays outside the fit as validation.
Before any laminate result is read, the cohesive layer is verified on benchmark cases against analytical solutions. Justusson and colleagues check at least three elements across the process zone and damping dissipation below 5% of total internal energy, and report mode II convergence sensitive to displacement rate; we script such gates into every run. Validation then uses notched layups the model has not seen, with other stacking sequences, hole sizes and thicknesses. Scatter enters as ranges, so the answer is a band, not a line.
How do design allowables relate to a delamination simulation?
Allowables are test statistics. FAA Advisory Circular 20-107B says scatter from material and process variability is characterised by allowables or design values derived under 14 CFR § 2x.613, and that static strength is substantiated by analysis supported by test evidence only when detail, subcomponent and component tests show local strains adequately predicted and positive margins with a validated analysis everywhere. Damage tolerance and fatigue need component tests unless experience supports the analysis. Simulation works inside that building block: it chooses which layups, hole sizes and ply drops to test, explains the failure modes the tests show.
A calibrated model is not a certified allowable
Where does AI help UD laminate design, and where does it not?
- Surrogates of the damage model. Chuaqui and colleagues use a Gaussian-process surrogate of a progressive-damage finite element model in Bayesian optimisation of open-hole tensile strength over stacking sequences, constrained by in-plane stiffness, ply balance and mid-plane symmetry. We build the same on your calibrated model, with a stated range and a gate to the full model.
- A smaller design space. Ply counts at fixed angles and lamination parameters make the stacking search continuous; the sequence is recovered under blending and manufacturing rules.
- Calibration and scatter. Toughness, strengths and exponent are fitted to coupon curves as ranges and sampled through the surrogate to give a band on notched strength.
AI does not repair a missing mechanism: a model without kinking will not predict compression failure however good the surrogate, and a surrogate inherits the bias of the model that trained it, It stops at the edge of its sampled layups, hole sizes and materials, where the full model runs. See our surrogate modelling, hybrid physics-AI, uncertainty quantification and optimisation pages and our articles on surrogate models and validating them.
From one laminate study to a workflow your team keeps
The return comes when your engineers run the next layup or ply drop through the same chain.
- Physics model. CFD and FEA set up once, as templates: geometry clean-up, mesh, solver settings and post-processing that every later run reuses.
- Validation. Mesh and time-step studies, and comparison with tests or full-scale data, so the model's uncertainty is known before it is trusted.
- Automated runs. Scripted runs over the parameters and operating conditions that matter, on your hardware or in the cloud.
- AI surrogate. A machine-learning model trained on those runs answers in seconds and says how sure it is; low-confidence questions go back to the solver.
- Decision tool. Optimisation, trade-off charts or operating guidance, in a form your engineers and operators use every day.
- Field data. Test, trial and monitoring data flow back to recalibrate the model, so it improves with every project instead of being rebuilt.
- A parametric laminate template in your solver, Abaqus, Ansys or LS-DYNA: layup, ply thickness and notch or ply-drop geometry as parameters, mesh sizes set from the process zone length, a fibre-aligned mesh per ply.
- A calibration record: toughness, strengths and exponent, each with coupon source and scatter.
- A verification suite of DCB, ENF and single-leg-bend cases, with element-count and damping-energy gates on every run.
- A validation record on held-back notched layups, error per failure mode, tolerances set before the run.
- A surrogate with a stated range and a gate to the full model.
- Handover and training: our training and software development services.
Questions engineers ask about composite delamination simulation
How many elements do you need across the cohesive zone?
Cohesive elements or VCCT for delamination?
Why does my open-hole prediction change with the mesh?
Do thin plies delaminate less?
Can simulation give design allowables?
If a stacking change, a ply drop or a notched-strength campaign is waiting on this, send us the layup and ply thickness, the notch or ply-drop geometry, your solver settings and the coupon records you hold: DCB and ENF curves, open-hole load-displacement data and failure-mode photographs. We reply with the model chain, the verification and validation we would run, the mesh rules and what a surrogate could cover. Start with a conversation, or see our unidirectional composites and composite modelling approaches pages, the modelling-scale guide and our composites fatigue and consulting services.