Seat foam simulation for hardness, pressure and meat-to-metal contact
A cushion that feels hard under the thighs or finds the frame under the pelvis is found late and fixed with another round of prototype foam. Simulating the foam, the cover, the frame and the sitter together compares the changes on a predicted pressure map first.
Seat foam simulation predicts how a cushion loads the person on it: the contact pressure under the pelvis and thighs, the foam response along its whole compression curve, and the contribution of the cover and the frame beneath. We build it around your existing solver, so a foam grade, cover tension or suspension change is compared on a predicted pressure map before the next set of prototype cushions is made.
The seating review is close to tooling release for the foam mould and the trim pattern. The rating says the cushion is hard under the thighs and the pelvis feels the frame. A softer foam grade, a relaxed cover and a different spring mat are all on the table, each needing new cushions and another evaluation round. Which change moves the pressure where, and what support do you give up? A model answers only if foam, cover, frame and sitter are all in it.
What does a seat foam hardness number tell you?
Foam hardness is an indentation reading. ISO 2439:2008 specifies four methods, A to D, for indentation hardness and a fifth, E, for compressive deflection coefficient and hysteresis loss rate. Method A reads one 40%/30 s index; Method B reads 25%, 40% and 65% to show the shape of the curve. Its scope adds that results relate only to the test conditions and cannot, in general, be used directly for design purposes. A hardness figure is a control index, not a material model, and two foams can share it while loading an occupant differently.
- Cell-wall bending. At small strain the foam responds linearly while cell walls bend. This stage is short, and it sets the first feel of the surface under a light touch.
- Plateau. Cell walls buckle and the stress rises slowly over a long stroke. Most of the seating travel sits here, and it is where a hyperfoam fit can turn unstable, so a calibrated card is run in the model before it is trusted.
- Densification. The cell walls crush together and the stress climbs steeply. Foam that is thin over a stiff frame member reaches this stage under the pelvis, and the pressure peak follows.
- Hysteresis. Unloading runs below loading, so energy is dissipated and the response depends on rate and history. Sitting down, settling and getting up are three different paths, and a purely elastic law cannot tell them apart.
- One hardness number. An indentation hardness index reads the curve at a single strain, 40% in Method A of ISO 2439. Two foams can share that reading and still differ below and above it.
- Different regions, different curve. Under the thigh the foam is indented shallowly, under the pelvis deeper. Foam A is firmer on first contact, foam B firmer deep in the stroke, so the thigh feels the firmer start of A and the pelvis the firmer finish of B. The model needs the whole curve, which is why Method B of ISO 2439 reads three strains.
The Abaqus documentation describes three stages of a compression curve. Below about 5% strain the foam is linear elastic as cell walls bend. A plateau follows from elastic buckling of the cell walls. Then densification crushes the walls together and the stress rises quickly. The pelvis presses the foam further along that curve than the thigh does, and foam that is thin over metal reaches densification. Mean contact pressure is force over contact area, so a foam that lets the body sink wider carries the same weight at lower pressure; one that bottoms out cannot.
How is seat foam simulation calibrated from compression tests?
The usual choice is a compressible hyperelastic law. For the isothermal case the Abaqus hyperfoam strain energy is U = Σi (2μi/αi2) [λ1αi + λ2αi + λ3αi − 3 + (J−αiβi − 1)/βi], with principal stretches λ, volume ratio J = λ1λ2λ3 and constants μ, α, β fitted to test data. The documentation warns that foam properties vary significantly from batch to batch, so specimens should share one batch and span the strains the seat will see.
A published example shows how much sits in the calibration. Liu, Beillas, Ding and Wang (2023) modelled seat-pan and backrest cushions with the LS-DYNA low-density foam model, which needs a compression curve and two unloading parameters, HU and SHAPE. The curve came from an ISO 2439 test of a 50 mm cube at 100 mm/min to 80% compression; HU and SHAPE were fitted by trial and error against a model of the test. A check under three masses led them to scale the stress-strain curves by 1.15, and they state that the source of the mismatch is unknown. A 15% change in foam properties then moved contact force by less than 7 N, yet peak pressure by −0.9 kPa (−6.4%) on the seat pan and 2.1 kPa (62.1%) on the backrest. Sensitivity differs by region, so a calibration is judged on the pressure you report, not on the curve alone.
Foam also depends on rate and history: Abaqus lets the elastic response of a viscoelastic foam be defined as instantaneous or long-term and adds stress softening, because unloading follows a lower path than loading. Stability is a second trap. A Sandia National Laboratories report on a different flexible foam finds plateau behaviour near the buckling transition very likely to cause stability problems in Hyperfoam and Flex Foam models. We run each calibrated card through its expected loading before trusting it.
What is meat-to-metal simulation, and why do cover and frame matter?
Meat-to-metal simulation follows the load from the occupant to the frame: foam deformation, foam-to-frame interaction and foam-to-occupant contact, as our meat-to-metal capability page describes. Strain in the foam is the indentation divided by the thickness left, so a cross-member, wire or spring mat close under the surface sets where the foam sits on its curve. Thin foam over stiff metal means high strain, and a pressure peak follows.
- Occupant soft tissue and bone. Pressure concentrates under the ischial tuberosities, the bony prominences of the pelvis, where bone sits close beneath thin tissue. A deformable human model supplies the tissue compression, the contact area and the posture the cushion produces. A rigid form cannot.
- Cover under tension. The trim is cut, sewn and stretched over the foam, so it carries pre-stress before anyone sits. It stiffens the surface, so it belongs in the contact model as a membrane with its own initial state.
- Foam pad, compressed. Under the pelvis the foam is pushed further along its compression curve than under the thigh. Where it is thin its cells pack together, and the stress climbs steeply. The model carries that curve, its unloading and its dependence on rate and time.
- Frame and suspension under the foam. A cross-member, wire or spring mat sets how much foam is left above it. Foam that is thin over stiff metal bottoms out and pressure rises fast. This foam-to-frame contact is what meat-to-metal simulation adds to a foam model.
- Contact pressure profile. The pressure map is the result: a peak under the pelvis, a lower rise under the thigh, and a contact area that grows as the foam lets the body sink. Mean pressure is force over contact area. Every value is an estimate that depends on the foam data and the human model.
- Load path. Body weight reaches the floor through the cover, the foam, the frame and the rails. The simulated contact forces on seat pan and back must add up to the weight carried, a check on the posture and the human model before the pressure map is trusted.
The sitter matters as much as the foam. Liu and colleagues also note that partial thigh-buttock models evaluate the seat pan only and that a complete seat needs a full-body model. Its own validation used one person, four seat-pan angles and flat 50 mm cushions; contact-force errors averaged under 22.3 N horizontally and 15.5 N vertically against a body weight of 785 N, and seat-pan contact area, peak and mean pressure matched well. The authors list the link between subjective feeling and objective parameters as open. So we validate on your seat, not a published one. Sitting needs deformable tissue, unlike the impact dummies in our crash test dummy simulation article.
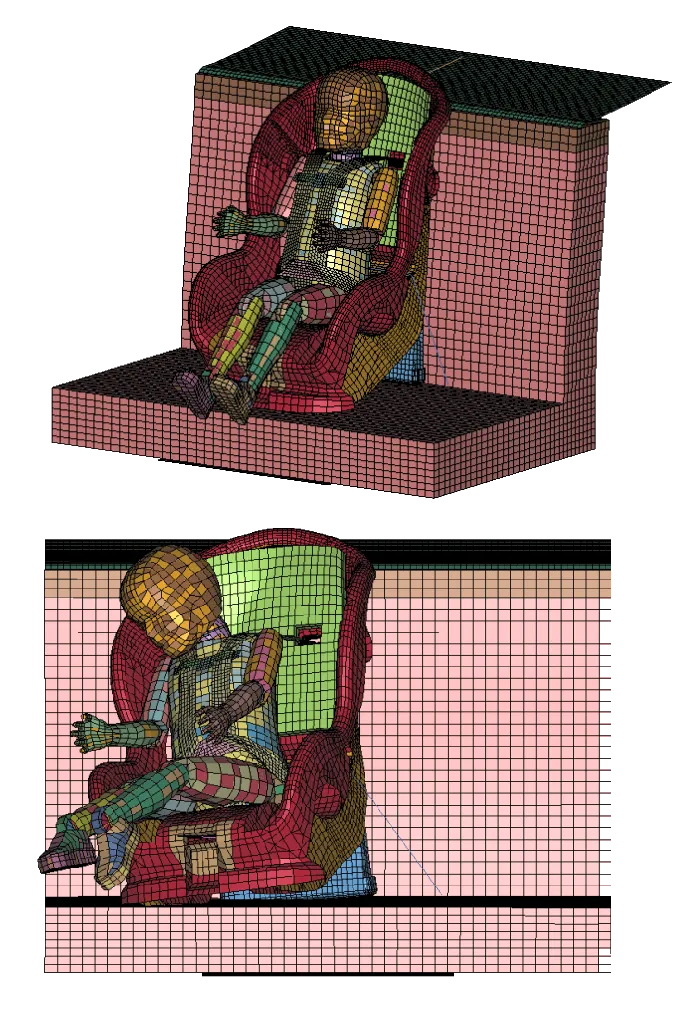
The cover is part of the contact. The abstract of SAE Technical Paper 2023-01-0910 says usually only the foam is modelled in interface-pressure simulation, yet the cover greatly changed the seat's surface stiffness and with it the deformation, the pressure distribution and even the simulated sitting posture. A cover arrives pre-stressed, stretched over the foam. Our softness and hardness prediction page describes chaining the stresses and strains of trim manufacturing and assembly into the seat model; we carry that as the initial state, not as a correction.
Posture is an output as well as an input. SAE J826 (June 2021 revision) states that its H-point devices are not to be construed as instruments which measure or indicate occupant capabilities or comfort. The device positions the manikin; the foam decides where the body ends up.
| Question | What the model carries | What it reports | Decision it supports |
|---|---|---|---|
| Compare two foam grades | Foam curve, cover, frame | Peak and mean pressure, contact area | Grade for the next prototype |
| Pressure under the pelvis | Deformable body, foam-to-frame contact | Pressure map, foam left over the frame | Cross-member or spring-mat revision |
| Cover change | Cover stiffness and pre-stress | Surface stiffness, pressure, posture shift | Cover material and tension |
| Different body sizes | Scaled or morphed human models | Pressure range across the population | Whether one foam serves all |
| Long sitting | Viscoelastic foam under load | Pressure and posture over time | Whether to extend the bench test |
How do you validate a seat comfort simulation?
SAE J2896, Motor Vehicle Seat Comfort Performance Measures, a Recommended Practice issued in January 2012, states in its scope that its test procedures apply to complete seat systems, production seats or prototypes built at the intended manufacturing quality, and can be modified for subsystem or component level testing. We cite that scope text only. A foam block tested alone validates the foam, not the seat. We validate the foam on the test it was fitted to, then under a loading it was not fitted to, then the assembled seat against your own pressure map and posture record, with tolerances set before the run. Foam batch, cover tension, friction and body size are swept, so each map is a range.
A pressure map is an estimate, not a comfort rating
Where does AI help seat foam tuning, and where does it not?
Cost is the reason to ask. In the study above, one 500 ms seating run took about 1 h elapsed on 36 cores, for a cushion block under a full-body model, and every design point multiplies that.
- Calibration. An inverse method fits the card to your compression and indentation tests and returns a range, replacing hand tuning of parameters such as HU and SHAPE.
- Screening. Runs planned over foam grade, thickness, cover tension, suspension stiffness and body size train a surrogate for peak pressure, contact area and zone pressures inside a stated range; full runs stay for the decisive designs. See surrogate models for CFD and FEA.
- Sensitivity ranking shows which foam property is worth measuring more accurately.
It does not rate comfort. A surrogate inherits every error of the model beneath it, cannot extrapolate beyond its range, and cannot say which pressure pattern your customers prefer. See AI surrogate models you can sign off.
From one seat study to a comfort workflow you keep
The return comes when your engineers can put the next foam grade, cover or suspension revision through the same chain without rebuilding anything.
- Physics model. CFD and FEA set up once, as templates: geometry clean-up, mesh, solver settings and post-processing that every later run reuses.
- Validation. Mesh and time-step studies, and comparison with tests or full-scale data, so the model's uncertainty is known before it is trusted.
- Automated runs. Scripted runs over the parameters and operating conditions that matter, on your hardware or in the cloud.
- AI surrogate. A machine-learning model trained on those runs answers in seconds and says how sure it is; low-confidence questions go back to the solver.
- Decision tool. Optimisation, trade-off charts or operating guidance, in a form your engineers and operators use every day.
- Field data. Test, trial and monitoring data flow back to recalibrate the model, so it improves with every project instead of being rebuilt.
- A seat model template in your existing solver, LS-DYNA or Abaqus, holding foam pad, cover, frame, suspension and their contacts.
- A calibration script from your compression and indentation test files to a foam material card, with the fit and its range on record.
- A sitting set-up with posture, load steps, body-model position and friction as parameters.
- A validation record against a pressure map and posture measurement on your assembled seat, with tolerances set before the run.
- A surrogate with a stated range in foam grade, thickness, cover tension, suspension stiffness and body size, and a gate to the full model outside it.
- Handover and training, so your team runs and extends it. See our training and software development services, and the seat design hub.
Questions engineers ask about seat foam simulation
What is meat-to-metal simulation?
How is seat foam hardness measured?
Can simulation tell me whether a seat is comfortable?
Which material model is used for seat foam?
Does simulation replace the SAE J2896 test or a prototype?
If a foam grade or cover change is waiting on a pressure number, send us the seat section or CAD with foam thickness over the frame members, the compression and indentation test files for the grade, the cover material and any pressure map of the current seat. We reply with how we would build the model, the pressure outputs it would report, and what the validation record should contain. Start with a conversation, or read the softness and hardness prediction and meat-to-metal pages.