Seat thermal comfort simulation for heated and ventilated car seats
A heated seat that warms the back but not the thighs, or a ventilated cushion that still feels damp, costs prototype seats and chamber sessions. Simulating the layers, the air path and the occupant shows what a heater layout or a perforation map does before the foam tool is cut.
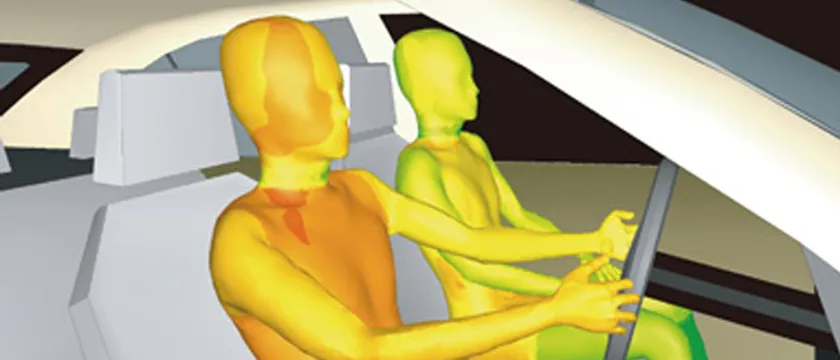
Seat thermal comfort simulation predicts how a heated or ventilated seat warms, cools and dries the person sitting on it: heat conducted through cover and foam, air pushed through ducts and perforations, and the body's response at each contact zone. We build that model around your existing FEA and CFD solvers, so a heater layout, a perforation pattern or a fan duty is tested on screen before the next prototype seat is cut.
The chamber report is back. The driver's lower back feels warm within a minute, the thighs take far longer, and the ventilated cushion moves plenty of air while the occupant still reports a damp seat. Each remedy is a new heater layout, foam cut or cover perforation, and each costs a prototype seat and a session with subjects while foam tooling waits. In an electric vehicle there is a second question: how much of the cabin's heating can the seat carry?
What does seat thermal comfort simulation need to capture?
A seat is a stack of layers, and heat, moisture and air each take their own path through it. A heater mat under the cover is the hottest layer and its heat goes both ways: qup = (Tmat − Tskin)/Rup towards the occupant and qdown = (Tmat − Tair)/Rdown into the foam, each R a sum of thickness over conductivity, ΣL/k. Moving the mat or changing the foam changes that split, so the same wattage buys a different warm-up.
The first seconds are set by contact. Two semi-infinite bodies in ideal contact settle at Tc = (e1T1 + e2T2)/(e1 + e2), with effusivity e = √(kρc), which is why leather and fabric at the same temperature feel different. Fojtlín and co-authors report that the seat's thermal diffusivity had been neglected in such simulations, and couple a one-dimensional seat model to a thermo-physiological model.
Moisture adds a second clock. Sweat leaves only if vapour can escape, so a cover that is thermally ideal and vapour-tight gives a damp occupant. The scope of ISO 11092 covers thermal and water-vapour resistance of fabrics, foams and leather, including multilayer assemblies, for use in upholstery among other products; those resistances are the measured inputs of the layer model.
Ventilation is a pressure-flow problem. Cover, foam and spacer layers are porous, so pressure drop follows −∇p = (μ/K)u + ρβ|u|u, calibrated on bench samples. The occupant compresses the foam, narrowing channels and closing perforations, so a seat tested empty misleads, and the air must reach the skin where the body touches the cover.
- Occupant and microclimate. Only part of the skin touches the cover. Between the contact patches a thin layer of air collects the heat and the moisture leaving the skin, and its temperature and humidity are what the occupant feels. The model needs the real contact area, which changes with body size and posture.
- Cover. Leather or fabric, perforated or not. Its thermal resistance sets how fast the heat of the mat reaches the skin, and its water-vapour resistance decides whether sweat can leave. Both are measured on layer samples and enter the model as properties.
- Heater mat, sensor and controller. The mat is the hottest layer. Heat leaves it in two directions, up towards the occupant and down into the foam, and the split follows the resistance on each side, so the depth of the mat matters. The controller holds the sensor reading at its set point, so where the sensor sits decides what is kept constant.
- Foam pad. Foam conducts heat poorly and has a large volume, so heat that goes down is mostly stored or lost, and the pad takes time to warm through. Under the occupant it is also compressed, which changes its thickness, its contact and its airflow.
- Ventilation channel and perforations. Air travels along the channel and up through the perforations in foam and cover to the microclimate. Flow through porous layers loses pressure through a viscous and an inertial term, and where the perforations sit decides which parts of the body the air reaches.
- Fan and duct. The fan runs where its pressure curve meets the resistance of duct, channel and perforations. A change of cover or foam moves that point, which is why the airflow is simulated along the whole path and with the seat occupied.
- Temperature profile. Qualitative. With heating on, temperature peaks at the mat and falls through the foam, so part of the energy goes down, not up. With ventilation on, the coolest point sits in the channel and the air carries heat and moisture away. The real shapes depend on layer properties taken from measurements.
How does the body enter the model, and what is the comfort criterion?
A seat has no comfort of its own; the occupant does, so the model needs a body. Paulke, Wagner and Schneider describe a finite-element implementation of Fiala's manikin: a passive part of skin, fat, muscle and bone layers solved with the bio-heat equation (conduction, metabolic heat, arterial blood heating), and an active part predicting shivering, vasomotion and sweating, with a contact condition that lets the seat conduct heat into a body segment. Lorenz, Fiala, Spinnler and Sattelmayer couple that kind of model to cabin CFD and validate it in a climate-chamber experiment with human subjects, assessing seat heating in the cold.
For criteria, ISO 14505 covers the evaluation of thermal environments in vehicles. Part 2, equivalent temperature, provides guidelines for assessing thermal conditions inside a vehicle compartment, primarily where deviations from thermal neutrality are relatively small. Part 3 gives guidelines and a standard test method for assessing thermal comfort in vehicles using human subjects. Both have 2026 editions; these lines come from the catalogue entries of the 2006 editions, so check which your customer's specification calls.
A cold-soak warm-up is far from neutrality, so we report local skin temperature and sensation by body part and validate against subject or manikin data. Fojtlín et al. find skin temperatures within the scatter of their measurements but weaker sensation predictions at the seat contact. Treat every output as an estimate.
Does a heated seat save energy in an electric vehicle warm-up?
It can, and an open measurement shows how. NREL tested zonal heating on two instrumented electric vehicles in a cold soak near 0 °C, with a 20-minute stationary warm-up against an unmodified control car. Driver-only vents, a lap vent and the heated driver seat at maximum cut heating energy by 13.6% with an equivalent warm-up time; adding a heated steering wheel (42 W average) and floor mat (129 W average) cut it by 28.5%. The authors attribute the saving to lower HVAC airflow; their manikin model predicted a colder driver without the heated surfaces.
They also state the limits: the tests were stationary, the benefit is expected to be larger in a transient warm-up than at steady state, and the sensation results were a test-to-test reference, not the driving population. What carries over is the method: heater power and HVAC energy on one clock, with the occupant's sensation as the constraint. The cabin side is in our passenger thermal comfort and EV thermal management articles.
- Contact zones. The seat back and the cushion warm the back and the thighs by conduction. Heat flux at the contact depends on the contact area and on the layers behind the surface, so the zone layout decides which body parts warm first.
- Cabin air. The vents warm the face, chest and hands by convection. A cold-soaked cabin heats slowly, because air, trim and glass all have to warm, so the airflow that reaches the occupant sets how fast the upper body responds.
- Core and regulation. The human model carries metabolic heat, blood flow and the body's regulating responses: shivering, vessel constriction and sweating. The same seat gives different results for different body size, clothing and metabolic rate, so the model is run over a range of occupants.
- Seat surface. The heater brings the surface up quickly and the controller holds it on a plateau. A fast rise is not the same as comfort: the surface limit, the sensor position and the zone layout decide whether the occupant feels warmth or a hot spot.
- Local skin temperature. Skin at the contact zones rises with the seat and settles in the target band of the comfort criterion you choose. Local skin temperature and local thermal sensation are what the model reports for each body part, with less certainty at the seat contact than elsewhere.
- Cabin air temperature. Air alone reaches the target latest. With the seat carrying part of the load, the cabin set point and blower flow can be allowed to rise more slowly, and the model shows how much that changes what the occupant feels.
- Energy balance. The seat heater draws power, and the cabin heating draws less when the occupant is warmed locally. Whether the total falls, and on which journeys, depends on warm-up time, ambient temperature and what the occupant feels. The bars show the trade, not a result.
How are heated and ventilated seats developed today, and where does it break?
Typically a supplier delivers a mat and fan to a specification, a prototype seat goes into a climatic chamber, and subjects or a manikin judge it. It works, and it is slow. Four things break.
- Layout follows packaging, not the heat path. If mat outline and depth are fixed by the foam cut and wire route, a warm-up complaint surfaces only in the chamber.
- Ventilation is tested empty. Airflow on an unloaded seat says little about a compressed cushion with a person on it.
- One occupant stands for a population. One body size and clothing level does not show the spread for the rest.
- The answer arrives last. Each change of cover, foam or heater needs a new prototype to learn what it did to skin temperature.
| Question | What the model carries | What it reports | Decision it supports |
|---|---|---|---|
| Heater-mat layout | Layer stack, mat zones, body contact, sensor | Surface and skin temperature, up and down heat split | Zone layout, mat depth, set point |
| Perforations and fan duty | Porous layers, channel, fan curve, occupied seat | Flow per perforation, pressure drop | Perforation map, channel, fan size |
| A damp seat | Vapour resistance, sweating, microclimate | Interface humidity over time | Cover and foam choice, perforation density |
| Comfort by body part | Manikin coupled to seat and cabin air | Local skin temperature and sensation | Whether a layout meets your criterion |
| EV warm-up energy | Seat, cabin air and HVAC load on one clock | Seat power and HVAC energy over a warm-up | How far set point and blower flow can drop |
How is seat thermal comfort simulated properly?
The chain has four links. Layer data: thermal and vapour resistance of cover and foam from sweating hotplate or equivalent tests, foam compression and flow resistance from bench samples. The seat model in your solver: conduction through the stack with heater zones and controller logic in Simulia Abaqus or Ansys LS-DYNA, porous airflow in Siemens Star-CCM+, Ansys Fluent or OpenFOAM, with the seat deformed by the occupant first. The body: a manikin with a contact condition at the seat and the cabin air around it. The outputs: warm-up curves at agreed points, flow per perforation, local skin temperature and sensation by body part, heater and fan power.
Verification covers mesh and time-step convergence, an energy balance (heater energy in equals energy stored plus lost) and porous coefficients reproducing the bench pressure-flow curve. Validation sets predicted surface and skin temperatures beside thermocouple logs on your seat and a manikin or subject session of the kind ISO 14505-3 describes, with tolerances fixed beforehand. NREL reports its cabin CFD within 1.6 °C of measured air temperature after ten minutes, with a largest early deviation of 3.5 °C: that is the form a record should take. Uncertainty in foam and cover properties, contact area, ambient temperature, clothing and body size is swept into a range.
A predicted comfort is not a comfort rating or a heater approval
Where does AI help seat thermal design, and where does it not?
- Layout search. Runs over mat zones, depth, perforation pattern and fan duty train a surrogate that returns warm-up curves, uniformity and energy inside its range; full runs are kept for the layouts that decide. See surrogate models for CFD and FEA.
- Calibration. Layer conductivity, contact resistance and porous coefficients are fitted to your bench and chamber data by an inverse method that returns a range.
- Record checking. A script flags chamber logs that deviate from the model beyond your tolerances.
It does not replace the occupant. A surrogate cannot predict outside its training range, inherits every error of the physics model, and cannot choose the comfort criterion. The subject session stays.
From one seat study to a seat thermal capability you keep
The return comes when your engineers can put the next heater layout, foam or perforation map through the same chain without rebuilding anything.
- Physics model. CFD and FEA set up once, as templates: geometry clean-up, mesh, solver settings and post-processing that every later run reuses.
- Validation. Mesh and time-step studies, and comparison with tests or full-scale data, so the model's uncertainty is known before it is trusted.
- Automated runs. Scripted runs over the parameters and operating conditions that matter, on your hardware or in the cloud.
- AI surrogate. A machine-learning model trained on those runs answers in seconds and says how sure it is; low-confidence questions go back to the solver.
- Decision tool. Optimisation, trade-off charts or operating guidance, in a form your engineers and operators use every day.
- Field data. Test, trial and monitoring data flow back to recalibrate the model, so it improves with every project instead of being rebuilt.
- A seat file holding layer stack, heater zones, sensor, controller, perforation map, duct and fan data.
- Thermal and airflow templates in your existing FEA and CFD solvers, with heater zones, body contact, controller logic, porous layers and the fan curve built in.
- A manikin coupling returning local skin temperature and sensation by body part.
- A validation record against your bench data and a chamber, manikin or subject session, with tolerances set beforehand.
- A surrogate with a stated range in zone layout, perforation pattern, fan duty and ambient temperature, with a gate that sends anything outside it to the full model.
- Handover and training, so your team runs and extends it. See our training and software development services, and the seat design hub.
Questions engineers ask about seat thermal comfort
Do heated and ventilated seats improve thermal comfort?
Which standards apply to thermal comfort in vehicles?
How much energy can a heated seat save in an electric vehicle?
Can simulation replace chamber or human-subject tests?
Which solvers do you use?
If a seat thermal complaint is holding up a foam tool or a chamber slot, send us a section drawing or CAD of the cushion and back with cover, foam, heater and duct layout, the heater and fan data sheets, and a surface-temperature log or manikin report for one seat. We reply with how we would build the model, the outputs it would report and what the validation record should contain. Start with a conversation, or read the seat thermal comfort capability page.