Seat transmissibility simulation for whole-body vibration comfort and SEAT value
A cushion or damper change moves the seat resonance, the SEAT value and the comfort on one road, and each answer costs a prototype and a shaker slot. Simulating the seat with a calibrated occupant model shows the transmissibility curve before the next build.
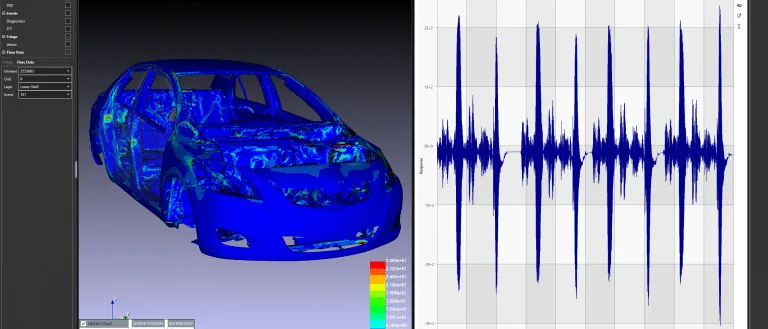
Seat transmissibility is the ratio of the vibration at the seat surface to the vibration at the seat base, at each frequency, and the SEAT value condenses that curve into one number for one input. We build simulation around your existing solver that predicts both from the foam, the suspension and a model of the occupant's apparent mass, so a cushion or damper change is tested before the next prototype goes on the shaker.
Foam tooling release is on the calendar. The seat meets its SEAT target on the shaker, then a test drive on one road leaves drivers describing a slow bounce the number never showed. Was it the cushion, the suspension setting, the road spectrum you tested with, or the person in the seat? Each answer costs a prototype and a shaker slot.
What is seat transmissibility, and what does the SEAT value tell you?
Treat seat and occupant as a mass on a spring and damper, shaken at its base. Transmissibility, output over input amplitude, is T = √[(1 + (2ζr)2) / ((1 − r2)2 + (2ζr)2)], with r the excitation frequency over the natural frequency and ζ the damping ratio. T exceeds one up to r = √2, equals one there for any damping and falls below one beyond it. Damping lowers the peak but raises the curve beyond the crossover: the basic trade in every cushion and suspension.
The SEAT value, seat effective amplitude transmissibility, turns the curve into one number for one input. Marcotte and colleagues define it as the weighted vibration on the seat over that at its base, as ISO 2631-1 rms acceleration or vibration dose value: below one the seat attenuates, above one it amplifies. They note that a cushion-only seat typically resonates around 4 Hz and helps only above about 6 Hz.
Two standards frame the measurement. The scope of ISO 2631-1:1997, as listed by BSI, covers whole-body vibration through the buttocks, back and feet of a seated person, 0.5 Hz to 80 Hz for health, comfort and perception, and excludes extreme single shocks such as vehicle accidents. ISO 10326-1:2016, as listed by SIS, covers laboratory testing of vibration transmission through a vehicle seat to the occupant, with the test input left to application standards.
- Road input. Vibration enters at the seat base with a spectrum set by road, tyres, suspension and driveline. The cyan band is a dominant band of that input. Where it sits on the curve decides the result: a dominant band near the resonance is amplified, whatever the overall SEAT value says.
- Resonance and amplification. Near the natural frequency of seat and occupant together, motion at the seat is larger than at the base. Damping sets the height of the peak, and the peak moves with occupant mass, posture and vibration level.
- Crossover. For a base-excited mass, spring and damper the transmissibility is exactly one at the square root of two times the natural frequency, whatever the damping. Below it the seat amplifies. Beyond it, the seat isolates.
- Isolation and damping. Beyond the crossover the seat attenuates. More damping lowers the peak but raises the curve there, which is the central trade in cushion and damper tuning. The dashed grey curve is the more damped case.
- Softer suspension seat. A lower natural frequency moves the resonance and the crossover down the axis, so more of the road spectrum falls in the isolated region. The price is travel: a softer suspension needs more stroke for the same input, which is why end-stops matter.
- Seat and occupant model. The platform shakes. The lower spring and damper stand for the foam and suspension and carry a seat block with the part of the body that moves with it. The upper spring and damper stand for the body's own resonance and carry the moving mass of the occupant.
Why can a seat with a good SEAT value still feel wrong on the road?
Because SEAT averages across the spectrum and people feel what dominates it. The suspension seat for subway operators of Marcotte and colleagues had vertical SEAT values of 0.86 to 0.99 against 1.05 for the old seat, yet cab vibration was dominated near 2.4 Hz and, at minimum suspension height, that component was amplified. Three of the five operators who reported discomfort had that setting. The authors call this not statistically significant and conclude that, with a dominant frequency, the transmissibility curve should be read beside SEAT.
The occupant is the second moving part. The apparent mass of the seated body, the complex ratio of force to acceleration at the seat surface, has a principal resonance that shifts with posture and level. Toward and Griffin fitted a single-degree-of-freedom model to twelve male subjects: the median damped natural frequency was 4.9 Hz without a backrest and 5.9 Hz against an upright rigid backrest, and fell from 4.72 to 3.78 Hz as random vibration rose from 0.125 to 1.6 m/s2 rms. A seat measured at one posture and level is one point on a family of curves.
Level matters on the seat side too. Marcotte and colleagues, summarising Wu and Griffin, describe five stages: friction lock-up with SEAT at one, nonlinear movement, a steady working range, end-stop strikes as SEAT climbs, and strikes on every cycle with amplification greatest. Soft suspensions suit continuous vibration and stiffer ones suit shocks, so the requirements contradict.
- Floor and rail input. Road and driveline input reaches the seat as acceleration at the rails. It is the base signal of every ratio, so its spectrum and its level have to be stated with any SEAT value.
- Suspension and end-stops. An air or mechanical spring with a damper and travel limiters. Continuous vibration calls for a soft suspension and shocks for a stiffer one, because striking the end-stops amplifies. Height and damping settings move the natural frequency and the damping ratio.
- Foam cushion. Polyurethane foam is hyperelastic and rate dependent: its dynamic stiffness depends on thickness, preload and vibration magnitude. The patch under the pelvis marks contact pressure, which depends on the same foam and on posture.
- Occupant. The body is a second resonant system, described by its apparent mass. Its resonance moves with posture, backrest contact and vibration level, and the pelvis pitches as the seat heaves, which couples vertical input into fore-and-aft motion.
- Two measurement points. The SEAT value is the weighted vibration on the cushion divided by the weighted vibration at the base. Below one the seat attenuates, above one it amplifies. The same two signals are read from a shaker, a road drive or a simulation.
- Lock-up, then a working window. At low level friction locks the suspension and the seat moves as a rigid body, so SEAT is one. As level rises it starts to move in a nonlinear way, then works in its linear range, where SEAT holds a steady value: attenuation for input above the seat resonance, amplification for input near it.
- End-stop impacts. Past the window the suspension strikes its buffers and SEAT climbs. When they are struck on every cycle, amplification of the base vibration is at its greatest. The window is set by travel, so travel is a design variable.
Duration adds a third axis. Marcotte and colleagues list time factors, discomfort that appears after prolonged sitting due to fatigue, beside static and dynamic comfort, so a long-drive target needs exposure time in the specification, not only the shaker spectrum.
How is seat dynamic comfort tuned today, and where does it break?
Usually on a shaker with prototypes. ISO 10326-1 testing, as Marcotte and colleagues describe it, uses at least two subjects at the 5th and 95th percentile body weight of the user population, a representative input spectrum, three trials per subject and mid-travel suspension. It is the right test and a slow loop: each foam or damper change needs hardware, and, as Toward and Griffin note, results depend on which people are selected and expose them to vibration.
Foam shows why intuition fails. In the finite element model of Zhang and colleagues, an occupant with spine and pelvis on a polyurethane foam seat calibrated to measurement, foam of 60, 80 and 100 mm lowered the predicted vertical peak frequency from 4.11 to 3.93 to 3.75 Hz and the SEAT value from 94.26 to 80.44 to 70.79 percent, with diminishing returns, while the peak transmissibility rose from 1.99 to 2.31 to 2.45. One number rewards what the other punishes.
How do you simulate seat transmissibility properly?
The chain has four links. First, the input: seat-rail spectra and levels from your virtual road-load model and path analysis, not derived again. Second, the seat: frame and mounts as a flexible body when their modes matter, see flexible multibody coupling, foam as a hyperelastic, rate-dependent material, and the suspension with friction, damping and end-stop contact. Zhang and colleagues fitted a hyperelastic strain-energy function to uniaxial shear and compression tests and checked it against a measured dynamic stiffness at 600 N preload and 0.4 m/s2 rms; stiffness depends on preload, thickness and level.
Third, the occupant, where the honest uncertainty sits. A lumped apparent-mass model with parameters that follow posture and level may be all a question needs: Toward and Griffin say a more complex model may be hard to justify if it does not reflect the large influences of magnitude, posture and individual variability. A finite element occupant adds spine, pelvis and cross-axis response. Detail does not remove calibration: the multi-body occupant on viscoelastic foam of Joshi, Bajaj and Davies gave resonant frequencies higher than those generally associated with seated humans.
Fourth, the outputs: transmissibility between base, cushion, backrest and head, and weighted rms and SEAT for each input spectrum, per axis. An active suspension seat is tested the same way before any actuator is bought: the same seat and occupant with a controller closed around it, judged on stroke, end-stop contact and SEAT across levels.
Verification checks mesh, time step and that the foam model reproduces its own compression and dynamic stiffness tests. Validation sets simulated against measured transmissibility at stated occupant mass and posture, with tolerances fixed before the run. Uncertainty sweeps what matters: in the sensitivity study of Zhang and colleagues, seven parameters varied by 30 percent either way, foam damping, shear modulus, stiffness and Young's modulus moved the result most. Their occupant follows one body size, so we state results only for the occupants you validated.
| Question | What the model carries | What it reports | Decision it supports |
|---|---|---|---|
| Foam hardness or thickness | Foam dynamic stiffness at preload, apparent-mass occupant | Transmissibility curve, peak frequency, SEAT per input spectrum | Foam specification before tooling release |
| Suspension spring, damper, height | Friction, damping, end-stop contact, occupant mass range | SEAT across levels, onset of end-stop contact | Spring and damper rates, travel limits |
| Seat structure and recliner | Flexible frame and mounts, backrest contact | Frame and backrest modes, transmissibility to cushion and backrest | Stiffening and mounting changes |
| Pelvis pitch and cross-axis response | Finite element occupant with pelvis and spine | Fore-and-aft response to vertical input | Cushion and backrest contour |
| Active seat concept | Sensors, controller and actuator on the seat model | Closed-loop SEAT, actuator stroke, end-stop contact | Whether the concept earns its added parts |
A SEAT value below one is not a comfort approval
Where does AI help seat vibration design, and where does it not?
- Calibration. Zhang and colleagues combined a sensitivity study, third-order polynomial fits of the transmissibility peak against foam parameters and a genetic algorithm against measured transmissibility, and report the vertical fitting error falling by 44.9 percent. We build that loop around your solver and keep the fitted ranges in the record.
- A surrogate of the curve, not the number. Trained on runs over foam, damper, occupant mass and input level, it returns the whole transmissibility curve. SEAT for any road spectrum then follows as [∫W2|T|2G df / ∫W2G df]1/2, with W the frequency weighting and G the input spectrum, so one surrogate serves every input from your vehicle model. It holds where the seat is near linear, so level is an input.
It does not replace measurement on people. A surrogate cannot answer outside its training range, inherits the errors of the model beneath it and never decides acceptability; an occupant model learned from a few subjects inherits their variability. See surrogate models for CFD and FEA and AI surrogate models you can sign off.
From one tuning study to a dynamic-comfort capability you keep
The return comes when your engineers can put the next foam, damper or road input through the same chain without rebuilding anything.
- Physics model. CFD and FEA set up once, as templates: geometry clean-up, mesh, solver settings and post-processing that every later run reuses.
- Validation. Mesh and time-step studies, and comparison with tests or full-scale data, so the model's uncertainty is known before it is trusted.
- Automated runs. Scripted runs over the parameters and operating conditions that matter, on your hardware or in the cloud.
- AI surrogate. A machine-learning model trained on those runs answers in seconds and says how sure it is; low-confidence questions go back to the solver.
- Decision tool. Optimisation, trade-off charts or operating guidance, in a form your engineers and operators use every day.
- Field data. Test, trial and monitoring data flow back to recalibrate the model, so it improves with every project instead of being rebuilt.
- An input library of seat-rail spectra from your vehicle model and measured drives, with levels.
- A seat template in your solver, such as Ansys LS-DYNA or Simulia Abaqus, with foam, suspension and structure built in and the occupant set by mass and posture.
- A validation record of simulated against measured transmissibility at stated occupant masses and postures, with tolerances fixed first.
- A surrogate with a stated range in foam, suspension, occupant mass and level, and a gate that sends anything outside it to the full model.
- Handover and training, so your team runs and extends it. See our training and software development services, and the seat design hub.
Questions engineers ask about seat transmissibility
What is a good SEAT value?
At what frequency does a seat resonate?
Does ISO 2631-1 cover crash or seat-belt loads?
Can simulation replace shaker tests or ride evaluation?
If a foam release or suspension setting is waiting on a transmissibility curve, send us the seat build-up (foam specification, any dynamic-stiffness test, suspension type), seat-rail spectra and levels, one measured transmissibility with occupant mass and posture, and your SEAT or weighted rms target. We reply with how we would build the model and surrogate, the outputs it would report and what the validation record should contain. Start with a conversation, or read the seat dynamic comfort capability page.