Vibration fatigue and ground vibration test model updating for eVTOL structures
Many rotors at variable speed excite an eVTOL airframe across a wide band of frequencies. How a frequency-domain fatigue chain, a ground vibration test and a disciplined model update turn that into inspection intervals and test plans you can defend.
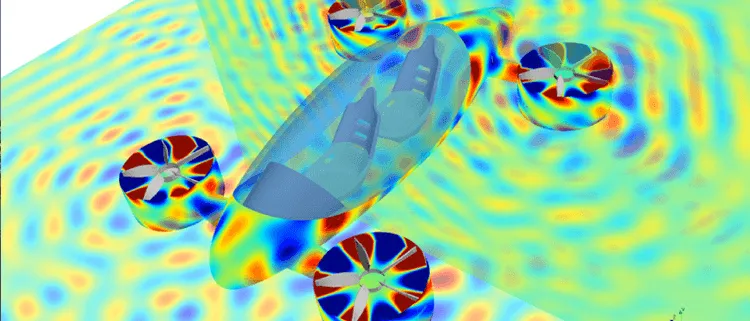
Vibration fatigue analysis for an eVTOL predicts the damage that rotor-speed harmonics do to the airframe, the motor mounts and the propulsion structure, by working from the stress power spectral density at each resonance. A ground vibration test (GVT) is what makes the model behind that stress believable: it supplies the measured frequencies, damping and mode shapes the model is corrected against before any damage number is trusted.
The inspection interval on a composite boom, the number of airframes you must fatigue-test and the date the aeroelastic clearance can start all depend on one question: does your finite element model put the resonances where the aircraft actually has them, and does it carry the right damping?
Why is vibration fatigue different on an eVTOL?
A multi-rotor eVTOL has many lift and thrust units, each shaking its mount once per revolution, at blade-pass frequency (blade count times rotational speed) and at their multiples. Speed is not fixed, because the units are throttled through hover, transition and cruise. The excitation sweeps a wide band, and every airframe, boom, mount or tray mode inside it can accumulate damage.
The regulator says as much. For multiple lift/thrust units with variable rpm, the EASA MOC-4 SC-VTOL, Issue 2 (11 July 2025) notes that they "could generate a greater range of harmonic frequencies with potentially different phases between LTUs", and that the effect of those combinations of harmonic, phases and natural frequencies should be investigated. The requirement behind it, VTOL.2215(b) of the EASA Special Condition for small-category VTOL-capable aircraft, Issue 2 (SC-VTOL-02, 10 June 2024), reads: "Vibration and buffeting must not result in structural damage". The MOC lists an impulse hammer test, instrumented flight test with a flight loads survey, and validated simulation as typical means, singly or combined. Analysis can support test planning and evidence; which analysis counts as a means of compliance is agreed with the authority, never by us.
- Rotor-speed excitation lines. Each rotor shakes its mount at once per revolution, at the blade-pass frequency (blade count times speed) and at their multiples. On a frequency-against-speed plot these are straight lines from the origin, and with many rotors at different speeds and phases there are many sets of them.
- Airframe modes and their damping. Wing bending, a boom or motor mount and a battery tray each have natural frequencies, drawn as horizontal bands. The width of a band stands for damping: the lower the damping, the taller the resonance peak and the narrower the band.
- Crossings are resonances you can dwell on. Where a line meets a band inside the operating range, the structure is driven at resonance. Whether that costs fatigue depends on how long the aircraft stays near the crossing and on how well damped the mode is.
- The operating range. Rotor speed varies with hover, transition and cruise, so the window is wide. Every crossing inside it needs checking, not only the one at cruise speed.
- Stress power spectral density. The response at each mode appears as a peak in the stress spectrum, drawn on the same frequency axis. Peak heights depend on the load, the mode shape at the hot spot and, above all, the damping.
- From spectrum to damage. Spectral moments summarise the shape of the stress spectrum, an estimator such as the Dirlik formula turns them into a distribution of cycle ranges, and Miner's rule sums the damage against the S-N curve. Damage grows as the stress to a high power, so a modest damping error becomes a large life error.
Frequency-domain or time-domain: which vibration fatigue method applies?
In the frequency domain we solve the model for its modes, compute the stress response to a load spectrum, and summarise the stress power spectral density G(f) by its spectral moments, mj = ∫ fj G(f) df. For a narrow-band process, with one dominant resonance, stress ranges follow the Rayleigh distribution and the damage over time T is D = (ν0T / A) · (2√2 σ)m Γ(m/2 + 1), with A and m from the S-N curve, σ the rms stress and ν0 the rate of upward zero crossings, as Larsen and Irvine's review of spectral methods for variable amplitude fatigue prediction (NASA NTRS) sets out. With several modes the process is wide-band, and the Rayleigh form usually overestimates. Dirlik's formula fits the cycle distribution with one exponential and two Rayleigh densities, and Miner's rule sums the damage. For wide-band estimators see Benasciutti and Tovo (2005), International Journal of Fatigue 27.
No estimator is safe by default. Larsen and Irvine compared the spectral methods with rainflow counting of simulated time histories: agreement was good for most cases with some limitations, and errors grew as the S-N exponent grew, with Dirlik among the methods that underestimated damage for some wide-band spectra at higher exponents. The methods assume a stationary Gaussian process, and rotor harmonics are sinusoids. We treat the lines as constant-amplitude dwells summed with Miner and keep the spectral estimator for the random part, such as turbulence.
| Load | Method | Check before you trust it |
|---|---|---|
| Rotor harmonics at steady speed | Harmonic response, stress amplitude at each line, Miner by dwell time | Frequency of the crossing, damping of that mode |
| Turbulence and aerodynamic broadband | Random response, stress PSD, Dirlik or another wide-band estimator | Estimator against rainflow on a representative time history |
| Speed sweeps through transition | Time-domain response or swept-sine, rainflow | Sweep rate and dwell at each crossing |
| Landing and manoeuvre transients | Time-domain transient, rainflow | Nonlinear joints and non-Gaussian peaks |
| Mixed mission profile | Damage per segment, summed over the profile | Segment durations and the combined spectra |
Why is damping the input that decides the answer?
At a resonance of a lightly damped mode the dynamic amplification is 1/(2ζ), and for a broadband load the rms stress scales as ζ−1/2. Damage scales as stress to the power m, so the life of a lightly damped bracket depends on ζ raised to the power −m/2. Nothing in a standard finite element model predicts ζ: it comes from joint friction, bonded layers, composite damping and mounting, and it changes with amplitude. A value taken from a table can be wrong by a factor that survives every later step. We use GVT damping ratios for each mode and carry their spread through the damage calculation instead of one number.
What does a ground vibration test give the model?
A GVT excites the structure on soft supports with shakers or an impact hammer and fits natural frequencies, damping ratios and mode shapes from the response. The MOC describes finding natural frequencies by instrumented ground vibration testing and comparing them with the sources of vibration; if they fall within the source ranges, further substantiation such as instrumented flight test should follow. The same data tune the model behind flutter analysis; the physics is in our flutter and forced response article, and ground vibration testing is the capability page.
Correlation has two parts. The frequency error for each paired mode is the first. The Modal Assurance Criterion is the second: for a test shape φT and a model shape φF, MAC = |φTTφF|² / (φTTφT · φFTφF). It is one for the same shape and zero for unrelated shapes, and it ignores frequency and damping, so it is never read alone. NASA Dryden's update of the Aerostructures Test Wing model from ground vibration test data (Lung and Pak, NTRS) shows what a record looks like on a test wing, not an eVTOL: before tuning, the second and third modes were 53% and 12% off in frequency with MAC of 0.52 and 0.73; after tuning the errors were 1.38% and 0.39% and MAC 0.97 and 0.95, with the off-diagonal terms of the orthonormalised mass matrix down from 37% to 7.4%. The paper compares these with a 3% frequency and a 10% mass-orthogonality limit that it attributes to military specifications. We quote them as an example of gates, not as your acceptance criteria.
- The test article. The aircraft or structure hangs on soft supports so that rigid-body modes sit far below the elastic ones. A shaker or an impact hammer excites it and accelerometers on the airframe, wing and motor mounts record the response.
- Measured modal set. Curve fitting of the response gives natural frequencies, damping ratios and mode shapes. This is the measured truth the model is held to, and the only source of damping you can defend.
- Frequency error and MAC. Each test mode is paired with a model mode. The grid is the Modal Assurance Criterion: a bright diagonal means every test shape matches its model shape, and an off-diagonal value flags modes that are swapped or mixed. The frequency error is read alongside, because MAC cannot see it.
- Finite element modes. The model is solved for the same modes, at the sensor points only, so that the comparison is like with like.
- Bounded parameter update. When a gate is missed, a few physical parameters are changed within stated bounds: mount and joint stiffness, local mass such as the battery pack, bonded-joint stiffness. The modes are recomputed and the loop closes. Bayesian updating returns the parameters with their uncertainty.
- Hold-out check. Some measured modes, or a second test configuration such as a different pack mass, are kept out of the update. If the model still predicts them, it is not just fitted to the modes it saw.
- Frozen model and correlation record. The accepted model is versioned with the test data, the gate values, the parameter changes and the damping values. The flutter and fatigue chains run on this model and nothing else.
Which parameters should you update, and how do you avoid over-fitting?
Update what is uncertain and physical, and little of it. The hard-to-model items on an eVTOL are the stiffness of motor mounts and isolators, bolted and bonded joints in composite structure, and the mass and attachment of the battery pack. A pack adds a large mass through a tray, foam, adhesive or straps whose stiffness is uncertain. Our composite modelling article covers the scale problem behind bonded joints. Tuning plate thicknesses or a global modulus to hit a frequency can match the modes and still be wrong elsewhere.
Three habits keep the update honest. Choose a short parameter list, each tied to a joint, mount or mass you can name, with bounds and priors. Keep some modes, or a second configuration such as a different pack mass, out of the update and predict them afterwards. And watch the mass and stiffness behind the match: the NASA paper says tuning needs good correlation and also retention of mass and stiffness properties. Mottershead and Friswell (1993), Model updating in structural dynamics: a survey, Journal of Sound and Vibration 167 surveys the methods.
A model that matches every GVT mode has not been validated
Where does AI help vibration fatigue and GVT, and where does it not?
- Bayesian updating with uncertainty. The update returns a distribution over mount and joint stiffness and mass, not one best-fit set, and it carries through to the damage. See our article on AI surrogates you can sign off.
- A surrogate of the stress PSD over the parameter sets you vary, trained on a planned set of runs, so a rotor-speed schedule or a mount change is screened quickly. See surrogate models for CFD and FEA.
- Active sensor placement. The NASA wing paper chose sensor locations by effective independence and a genetic algorithm, which gave a higher Fisher information determinant.
- An anomaly gate on in-service vibration. Measured frequency and amplitude are compared with the frozen model, and a shift is flagged. SC-VTOL-02 asks, for Category Enhanced, for provisions for in-service monitoring of parts important to safety; whether a gate serves that is for you and the authority to decide.
Where AI does not help: replacing the correlation evidence or the physical measurement of damping. A network cannot know the damping of a joint it has not seen, and it extrapolates poorly to a new pack or mount. Physics sets the structure, the test sets the parameters, and the surrogate is stated with the range it was trained on.
From one test campaign to a vibration capability you keep
A GVT report and one fatigue study answer one aircraft in one configuration. We build the workflow so the next battery pack, motor mount or rotor schedule does not start from scratch, your own team runs it, and every answer is judged the same way.
- Physics model. CFD and FEA set up once, as templates: geometry clean-up, mesh, solver settings and post-processing that every later run reuses.
- Validation. Mesh and time-step studies, and comparison with tests or full-scale data, so the model's uncertainty is known before it is trusted.
- Automated runs. Scripted runs over the parameters and operating conditions that matter, on your hardware or in the cloud.
- AI surrogate. A machine-learning model trained on those runs answers in seconds and says how sure it is; low-confidence questions go back to the solver.
- Decision tool. Optimisation, trade-off charts or operating guidance, in a form your engineers and operators use every day.
- Field data. Test, trial and monitoring data flow back to recalibrate the model, so it improves with every project instead of being rebuilt.
- A templated modal and fatigue chain in your existing solver: normal modes, harmonic and random response, stress recovery and one damage report format for every component.
- A GVT-to-model updating loop with correlation gates. Frequency error and MAC computed the same way after every test, parameters and bounds written down, hold-out modes reserved, and a record keeping test data, gate values and model version together.
- A surrogate of the stress spectrum over the parameter sets you actually vary, with its range stated and a route back to the solver outside it.
- An in-service comparison of measured vibration with the frozen model, so a drifting joint or mount shows as a shift.
- Handover and training, so your engineers can extend the chain themselves. See our training and software development services.
Questions engineers ask about vibration fatigue and GVT
What is vibration fatigue?
When should I use the frequency domain, and when the time domain?
What does the modal assurance criterion tell me?
How many modes should I update to?
What do you need from us to start?
Our vibration fatigue and ground vibration testing pages sit inside the eVTOL, VTOL and UAM section, beside our general vibration fatigue simulation work and the thermomechanical fatigue article. If your GVT is planned or just done, send us the finite element model, the rotor speed range and the modal test report or test plan. We will reply with the modes and sensors we would use, the parameters we would update with their bounds and gates, and what the first correlation would let you decide. Start with a conversation.