School bus crashworthiness simulation for roof, joint and seat strength
FMVSS 220, 221 and 222 turn a bus body into a load path problem decided by its weakest joint. A validated model of roof, joints and seats tells you which variant to test first, and which change to make before tooling is cut.
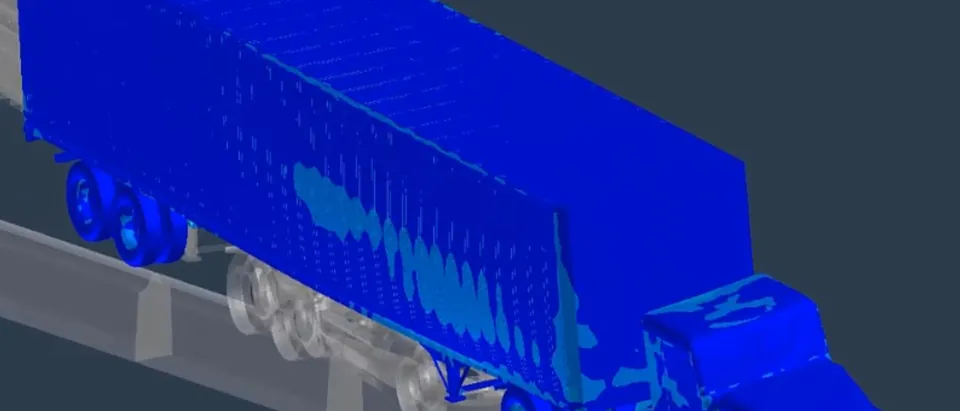
School bus crashworthiness simulation predicts how a bus body, its joints and its seats carry the loads that FMVSS 220, 221 and 222 apply, before a bus exists to test. We build it as a validated model and a workflow your team runs on every body, seat and joint change, around your existing crash solver.
Next model year's body changes three things at once: a taller window opening, a seat from a new supplier and a lighter roof skin. The roof-crush test needs a finished bus. The seat and joint tests need seats and coupons, and every variant is another set. If the roof fails late, the fix is a tooling change on a body already in production planning. Which variants go to the rig, and in what order, is the decision that costs the most.
What do FMVSS 220, 221 and 222 ask of a school bus?
Three standards carry the structural load case. We quote them from the eCFR text of 49 CFR Part 571.
- Roof, 49 CFR 571.220. A force of 1.5 times the unloaded vehicle weight in kilograms multiplied by 9.8 m/s² is applied through a force application plate. Downward movement at any point of the plate may not exceed 130 mm, and each emergency exit must open during the full force and after its release; a roof exit need not open during the force. The plate moves at not more than 13 mm per second.
- Joints, 49 CFR 571.221. Each body panel joint must hold the panel to its member under 60 percent of the tensile strength of the weakest joined body panel. The specimen is a 203 mm joint segment, pulled at 90 degrees to the joint, at 3 to 10 mm per minute until it separates.
- Seats, 49 CFR 571.222. A seat with another behind it is loaded through bars to 3,114W newtons, where W is the number of seating positions on the bench, then pushed until 452W joules are absorbed. Seat back deflection may not exceed 356 mm and the seat may not separate at any attachment point. Head zones are struck at 6.7 m/s and leg zones at 4.9 m/s, with a knee-form force limit of 2,669 N.
Standard 220 states its purpose as reducing deaths and injuries from “failure of the school bus body structure to withstand forces encountered in rollover crashes”. In equation form the roof force is F = 1.5 m g with m the unloaded mass: 14.7 N per kilogram, so lightweighting lowers the load and the material that carries it. Fixtures, rates and pass criteria are written down, which lets each test be modelled directly.
- Force plate and travel limit. The roof test pushes a flat, rigid plate down on the roof at a limited speed until the specified force, set by the unloaded mass, is reached. The question is how far the plate has moved by then, against a stated limit.
- Roof skin and bows. The roof is a curved shell stiffened by bows. It spreads the plate force sideways, and its curvature and bow spacing decide how much goes into each pillar and how early the roof starts to buckle.
- Pillars and floor: the load path. The force runs down the window pillars to the floor and sills. A pillar that is slender in its weak direction buckles first, and the load moves to its neighbours.
- Joints. Where the roof meets a pillar and where a pillar meets the floor, spot welds, rivets, bolts and adhesive carry the force across. The weakest joint decides the result, which is why joint models are calibrated from coupon tests before the body model is trusted.
- Emergency exit frame. The standard also asks that exits can be opened under the force and after it. The model reports how much each exit frame distorts, so the opening check on the real bus can be planned; the opening itself is confirmed by test.
- Force against plate travel. The force must reach its target before the travel limit. If a joint opens, the curve turns over: load sheds into neighbours and travel runs away. The shape of this curve tells you which joint to look at, not only whether the body passes.
- Rigid support. The test replaces non-rigid chassis-to-body mounts with rigid ones and supports the vehicle on its frame. A model that keeps the production mounts answers a different question from the one the standard asks.
Why is bus rollover simulation harder than a car crash model?
A bus body is a long frame of slender pillars, bows and rails held together by spot welds, rivets, bolts and adhesive lines. The load runs from the plate through the roof bows into the pillars and down to the floor, and the first joint to open sheds its load onto its neighbours. Buckling and joint rotation matter as much as yield, so the result sits with the weakest joint, not the average one.
Time scale is the second difficulty. At the plate's maximum 13 mm/s, 130 mm of travel takes ten seconds. An explicit solver's stable step is of the order Δt ≈ L/c, with L the smallest element length and c = √(E/ρ), about 5 km/s in steel. Elements a few millimetres long give steps of about a microsecond, and ten seconds becomes millions of them. So the plate is driven faster than the test, or an implicit solver is used, and the energy balance proves the run is still quasi-static: kinetic energy a small fraction of internal energy, and the same curve at half the rate.
A real rollover is another problem. Tanov, Brueggert and Yang (SAE, 2003) describe a school bus finite element model run for rear and side impacts of several hundred milliseconds and for several seconds of rollover. In Europe, UN Regulation No. 66 governs the superstructure strength of large passenger vehicles; Wicaksono and co-authors (Journal of Engineering and Technological Sciences, 2017) apply it in a finite element rollover of a bus whose mass distribution represents a real one, empty and fully loaded. Mass and loading are model inputs that the standard you work to fixes.
How is school bus crash testing usually planned, and where does it break?
Usually as a sequence of physical gates: coupon tests for joints, one seat test per seat design, and one roof test on a complete bus late in the programme. That works while the body stays the same. It breaks when variants multiply: length, window layout, seat count, roof skin, supplier. Each combination is a different load path, and nobody can afford a bus for each one. Findings arrive when tooling is cut, and which joint failed last time sits with one engineer. A one-off simulation helps once, then cannot be rerun, because its joint model, mesh and loading settings were never recorded.
How do you simulate school bus roof, joint and seat strength properly?
We build from the bottom up, in the order the tests are specified, so each layer is validated before the next relies on it.
- Joint models from coupon data. Standard 221 fixes the method, so we reproduce that specimen for each joint type and calibrate force and displacement to separation against the coupon records. The allowable follows the standard: 60 percent of the weakest panel's tensile strength, with the section removed for fasteners subtracted.
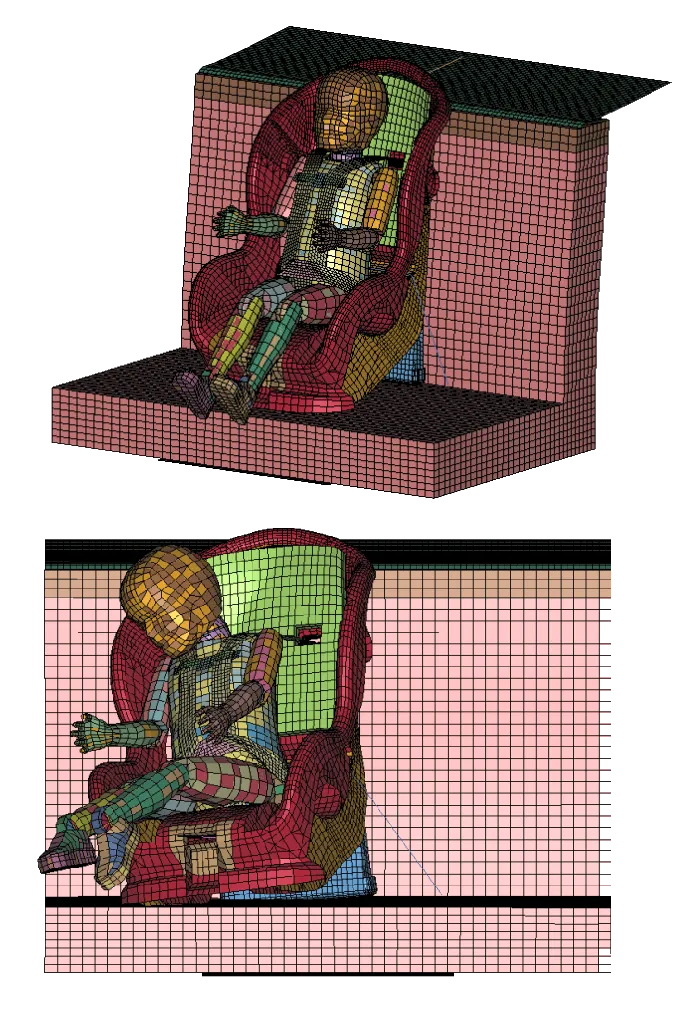
- Seat model against the loading-bar test. The 152 mm bar, the 3,114W newton load and the 452W joule energy are in the standard. The model includes a floor section and the anchorages, because a seat is only as good as the floor under it.
- The roof plate model. The plate is sized as the standard sets for buses above 4,536 kg gross vehicle weight rating: 914 mm wide and 305 mm shorter than the roof. Chassis-to-body mounts become rigid, roof-mounted parts come off, and the plate loads to 1.5 m g. We report plate travel and the distortion of every exit frame.
- Verification and scatter. Mass and centre of gravity against the weigh-in, energy balance, hourglass energy, contact penetration, and mesh convergence at the pillar joints. Then material, fastener quality, plate friction and loading rate as a spread on plate travel, never a single value. Our crash model credibility checks are in a crash simulation model you can trust.
The full rollover then goes on top. A rollover lasting seconds is not a plate test, so we couple a multibody roll with the explicit structure, as set out in our flexible multibody article, to see which pillar joints take the ground contact first. The plate test stays the reference; the rollover tells you whether a variant that passes it has a weaker neighbour.
- Energy-absorbing seat back. A high, padded seat back acts as the barrier for the passenger behind. It has to deflect enough to absorb energy and stop short of a limit, without separating from its frame. The dashed outline is its deflected position.
- Occupant load and loading bars. In a crash the passenger behind loads the seat back. The standard's seat test replaces that passenger with two rigid loading bars, one low and one high, so the load case is repeatable and can be modelled directly.
- Head zone. The padded upper part of the seat back is a head-contact surface. The standard limits the head-form acceleration and the force it can see, so padding thickness and stiffness are design variables.
- Knee zone. The lower back is where knees arrive. The standard limits the force the knee form can see and sets a minimum contact area, which pulls the design the opposite way from a stiff, thin frame.
- Seat anchorage. The seat is only as strong as its attachment to the floor. A seat that separates at an anchor fails the test, so the floor structure belongs in the seat model.
- Force against deflection. The area under the curve is the energy the seat back absorbs. Stiffer raises force and lowers deflection; softer does the reverse. The design target is both within the limits at once.
| Question | Model | Calibrated against | What to watch |
|---|---|---|---|
| Which joint type for a pillar? | Joint coupon model | Joint pull-test records | Failure mode, not only peak force |
| Does the roof hold with a taller window? | Plate-load body model | Section and joint tests | Rigid mounts, plate rate |
| Is the new seat acceptable? | Seat and floor model | Loading-bar test | Anchorage and floor deflection |
| Are head and knee zones safe? | Impact-zone model | Head-form and knee-form tests | Padding stiffness and contact area |
| What happens in a real rollover? | Multibody and explicit structure | Plate and section tests | Loading condition and mass |
| Which of many variants first? | Trained surrogate | The full-model run set | Stated range, gate to the model |
A passing simulation is not a passing bus
Where does AI help school bus crash design, and where does it not?
- Variant ranking. A surrogate trained on a planned set of solver runs over pillar section, bow spacing, skin and joint type ranks candidates by plate travel and joint load, without a new run for each. See surrogate models for CFD and FEA.
- Joint calibration. Inverse parameter identification fits a joint model to the coupon curves, with uncertainty on every parameter.
- Run gates. An anomaly check on energy balance and contact flags a bad run.
It does not replace the physics of a joint. A surrogate cannot predict a failure mode it has never seen, so a new roof architecture or panel material goes back to the full model. Its stated range comes with a validation record, which is what lets your team sign off the result. See AI surrogate models you can sign off.
From one roof test to a bus structure capability you keep
The return comes when your own team checks the next body length, seat or joint without a new project.
- Physics model. CFD and FEA set up once, as templates: geometry clean-up, mesh, solver settings and post-processing that every later run reuses.
- Validation. Mesh and time-step studies, and comparison with tests or full-scale data, so the model's uncertainty is known before it is trusted.
- Automated runs. Scripted runs over the parameters and operating conditions that matter, on your hardware or in the cloud.
- AI surrogate. A machine-learning model trained on those runs answers in seconds and says how sure it is; low-confidence questions go back to the solver.
- Decision tool. Optimisation, trade-off charts or operating guidance, in a form your engineers and operators use every day.
- Field data. Test, trial and monitoring data flow back to recalibrate the model, so it improves with every project instead of being rebuilt.
- A parameterised body model in Ansys LS-DYNA, ESI Pam-Crash, Simulia Abaqus or your existing crash solver: pillars, bows, skin, floor and exits, with the plate, support and seat-bar load cases scripted.
- A joint library: one record per spot weld, rivet, bolt and adhesive line, with the coupon curve, the calibrated model and the fit between them stored together.
- A validation record tying every model to the test it was checked against.
- Automated variant runs over body length, window layout, seat count and roof skin, with a gate that stops a bad run.
- A surrogate with a stated range over the variables you change, and a gate that returns out-of-range requests to the full model.
- Handover and training, so your engineers extend it themselves. See our training and software development services.
Questions engineers ask about school bus crashworthiness
What does FMVSS 220 require?
What does FMVSS 221 test?
What does FMVSS 222 require of school bus seats?
Can simulation replace the physical school bus tests?
What do you need from us to start?
If a roof, a joint or a seat is the next change on your list, send us the body structure model or drawings for one bus length, the joint and seat test records you already hold, the current weights, and the variants you are weighing. We will reply with how we would build the model, which joints and seats need coupon calibration first, what range a surrogate would cover, and what each result would let you decide before the test slot. Start with a conversation, or read about our school bus crashworthiness work in the crash test simulation section.