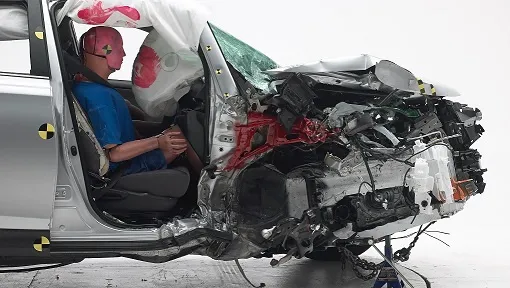
Small overlap crash test simulation for pillar, rocker and footwell intrusion
The small overlap and oblique crashes load a front corner outside the rails, through the wheel, hinge pillar, rocker and firewall. A model built to the protocol text, validated on residual intrusion and swept over its tolerances, tells you which structural option earns its mass.
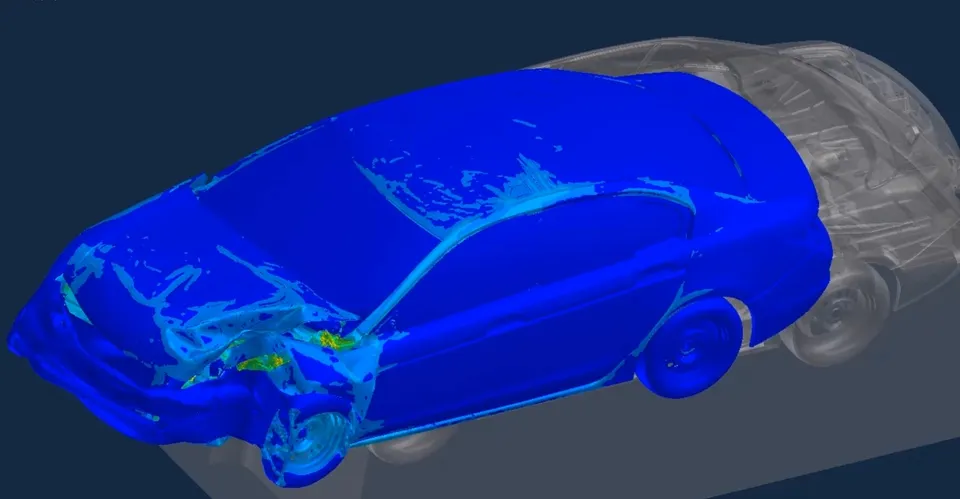
A small overlap crash test simulation reproduces the 25 % rigid-barrier frontal impact in an explicit finite element model, so you can see how the wheel, hinge pillar, rocker and firewall carry the load and how far the footwell moves while the structure can still change. We build that model, and the automated workflow around it, on your existing crash solver.
The body release is close to tool commitment. The front-left corner decides the small overlap result, and three options are on the table: a thicker hinge-pillar reinforcement, a stronger rocker, and a deflector that pushes the wheel outboard. Each costs mass or tooling, and the next barrier test is months away. Which option moves the footwell, and by how much?
What does a small overlap crash test simulation have to reproduce?
Start from the protocol text, because the model has to match it and not a summary of it. The IIHS small overlap crash test protocol, Version VIII (May 2025) specifies an impact at 64.4 ± 1 km/h with 25 ± 1 % overlap. The barrier is a rigid vertical steel plate, 38.1 mm thick and 1,524 mm high, 1,000 mm wide to the point where a 150 mm radius begins, on a base of 145,150 kg. A model that treats the barrier as an infinite flat wall has already left the test.
The measurements are as specific. The protocol marks 18 locations on the driver-side interior and exterior and records their coordinates before and after the crash. The small overlap rating protocol, Version VII (April 2024) builds the structural rating on the residual movement of seven interior points and three door-frame points, beside its ratings for restraints and for dummy injury measures. It says why structure counts: “Major deformation of or intrusion into the compartment is a good predictor of injury risk for people in similar crashes, even when dummy injury measures are low.”
The oblique crash asks a different question. In its December 2015 notice on upgrading NCAP, NHTSA describes an Oblique Moving Deformable Barrier of 2,486 kg that strikes a stationary vehicle at 90 km/h, with the vehicle at a 15-degree angle and a 35-percent overlap. The notice contrasts it with the IIHS test: that test, for most vehicles, does not engage the primary longitudinal structure, while the oblique barrier interacts with at least one frame rail and gives a more severe pulse that puts more weight on the restraint system. A frontal oblique test with the THOR-50M dummy is a planned NCAP addition, and the August 2026 notice proposes an implementation phase starting in the fourth quarter of 2029.
Why is a small overlap crash so hard to design for?
Speed alone sets the kinetic energy per kilogram: at 64.4 km/h, ½v² is about 160 J/kg. The structure does not have to absorb all of it. With one corner loaded and the rest free, the vehicle keeps moving and turns: ½mv0² = Eint + ½mv1² + ½Iω² + Eother, where Eint is the internal energy of deformation, v1 the speed after the crash, ω the yaw rate and I the yaw inertia. How much leaves as sideways motion and yaw depends on how the barrier edge, wheel and tyre interact, not on front-structure stiffness. A model tuned on a 50 % offset test, where the rails dominate, can fail here.
The load path runs through parts a legacy model simplifies: wheel, tyre, control arm and knuckle, the hinge-pillar joint, an A-pillar in hot-stamped steel with softer zones, the rocker and the firewall. Failure, not stiffness, governs: a ball joint, spot weld or pillar fracture that releases or transfers load changes the answer abruptly. And kinematics matter: a vehicle that yaws away loads the barrier less, and one that grips loads the cabin more.
- Rigid barrier and the overlap. The barrier edge sits at a fixed fraction of the vehicle width, here 25 %, with the speed and overlap each carrying a stated tolerance. The barrier does not deform, so the whole absorbed energy has to be taken by the vehicle structure.
- Rails outside the load. The overlap is outboard of the main longitudinal rails, so for most vehicles the structure built to absorb a frontal crash sees little of it. The crush zone runs out early and the load goes elsewhere.
- Wheel driven rearward. The front wheel and suspension are pushed back toward the hinge pillar and footwell. Where the control arm, the knuckle and the tyre fail or slide decides how much force reaches the cabin, and in which direction.
- Pillar, rocker and firewall paths. The cabin takes the load along three paths: the hinge and A-pillar upward, the rocker along the sill, and the firewall and toepan across. A design change moves the share between them.
- Compartment points. Intrusion is measured as the residual movement of marked points, from before the crash to after it. The model has to report the same points in the same coordinate frame, after the structure has come to rest.
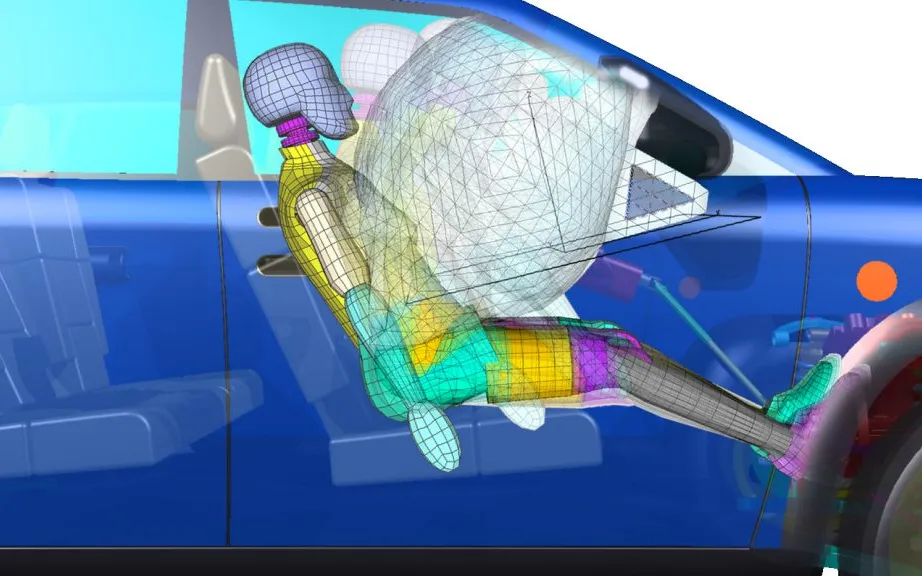
- Dummy and vehicle motion. The vehicle yaws and slides off the barrier edge while the dummy moves forward and toward the door, loading belt, airbag and instrument panel. Restraint timing is judged against that motion.
How are small overlap models usually built, and where do they break?
Most programmes add the small overlap barrier to the frontal offset model they already have. It breaks in four places, and we check them first.
- Wheel and suspension. An over-simplified or over-stiff wheel assembly cannot separate, fail a link or slide, so it sends the wrong force the wrong way.
- Contact. Penalty contact returns a force F = kδ for a penetration δ. Too soft, and the wheel passes through the pillar. Too stiff, and it excites noise or shortens the time step. The barrier edge sliding over sheet metal needs friction taken from tests, and a crushed pillar needs self-contact.
- Mesh and time step. The explicit time step obeys Δt ≤ Le/c, with c = √(E/(ρ(1−ν²))) for a steel shell, so the smallest element sets it. Mass scaling that holds Δt up adds mass in the very region where intrusion is read. We check added mass against vehicle mass, and hourglass energy against internal energy.
- Material and joint failure. Spot welds and softened zones fail in the test and often hold in a model never asked to fail them.
These are the checks from our article on a crash model you can trust, applied to one corner. See also our crash test simulation and small overlap and oblique pages.
| Question | Set-up as the protocol text states it | What the model must get right | Decision it supports |
|---|---|---|---|
| IIHS small overlap, driver side | 64.4 ± 1 km/h, 25 ± 1 % overlap, rigid barrier with a 150 mm radius edge, Hybrid III 50th percentile male driver | Wheel failure, pillar and rocker paths, residual movement at the marked points | Which pillar, rocker or toepan option earns its mass |
| IIHS small overlap, passenger side | The same test on the passenger side, with a Hybrid III in the front passenger seat | The asymmetric layout and restraint | Whether the driver-side fix carries across |
| Frontal oblique, NHTSA | 2,486 kg oblique barrier at 90 km/h into a stationary vehicle, 15 degrees, 35 % overlap | Rail engagement, pulse, restraint timing with a THOR-50M dummy | Compartment and restraint tuned together |
| Offset, Euro NCAP | Mobile progressive deformable barrier face on a trolley, impact angle 0° ± 2°, THOR 50th percentile driver | Barrier and trolley interaction, rail and crush-zone behaviour | Front-end structure and restraint |
| Your own variant | Another overlap, speed or barrier in your load-case file | The same model, other load cases, swept over tolerance | How the design degrades away from the nominal |
How do you validate a small overlap model against the test?
Validation is a record, not a plot. Compare what the test reports: the post-crash positions of the marked points, the compartment accelerations filtered to the protocol's channel class (CFC 60, SAE J211/1), event timing from 500 frames per second video, which the protocol says can be early or late by 2 ms, and the head and knee contact marks. Each comparison gets a tolerance before the run and a result after it.
Then state the spread. Run the model across the protocol's own tolerances: for a vehicle 1.8 m wide, 1 % of overlap is 18 mm of barrier position, and a step in the response can sit that close. Add the inputs nobody measured, such as friction, weld strength and tyre pressure, and report a range of intrusion, not one curve.
Intrusion is residual movement, not the peak
Where does a small overlap simulation stop?
Simulation supports design decisions and test planning: choosing between structural options and arriving at the barrier with a structure already checked in the same configuration. It does not produce a rating, and nothing we build certifies, rates or approves a vehicle. Whether virtual evidence counts is agreed with the programme. The Euro NCAP Crash Protection Frontal Impact Protocol, version 1.2 (July 2026), for example, scores its sled and virtual load cases from manufacturer data, and states that when the virtual data does not meet its validation criteria, only the sled load cases are scored on physical data.
Where does machine learning help small overlap design, and where does it not?
- Surrogate-assisted structure optimisation. The variables are gauge and grade of pillar, rocker and reinforcements, and the wheel deflector geometry. The responses are the ten structural points, mass and the compartment pulse. A planned set of explicit runs in Ansys LS-DYNA, ESI Pam-Crash or Simulia Abaqus trains a surrogate per response, the optimiser works on it, and every candidate is confirmed in the full model. See surrogate models for CFD and FEA.
- Adaptive sampling and a mode classifier. New runs go where two neighbours disagree about the mode, and a classifier says whether a design lands in the wheel-slides-past, pillar-fracture or rail-engages mode. It drives the gate.
- Run triage. Energy balance, added mass and contact penetration are checked automatically, and a failed run never enters the training set.
- Response of the explicit model. Intrusion against overlap offset, drawn qualitatively. A gentle slope is interrupted by a step where the load path changes: the barrier edge begins to load the rail, or the wheel stops sliding past the pillar.
- Tolerance band. The test allows a small tolerance on overlap and on speed. A band that narrow can still sit next to a step, so the nominal run alone does not show how robust the design is.
- Planned run set. Design-of-experiments points spread thinly on the plateaus and more densely around the step, with new points added where two neighbouring runs disagree about the mode.
- Smooth surrogate. A smooth fit rises gradually through the step. It over-predicts intrusion before the step and under-predicts it after, which is the error that matters because it hides a design that crosses the step.
- Gate. A classifier on the step flags requests near it, and the gate returns them to the full model. Outside the zone and inside the stated design range, the surrogate answers.
- What moves the step. Overlap and speed within tolerance, barrier edge and contact friction, and mesh and mass scaling can each shift the step. They belong in the run set and the validation record, not in a footnote.
It does not replace the physics at the step. A regression trained on designs that share a load path has nothing to say about one that changes it, and it inherits every error in the base model. A surrogate has a stated range, and outside it the request goes to the full model. See AI surrogate models you can sign off.
From one corner study to a small overlap capability you keep
The return comes when your own engineers can put the next corner, pillar grade or wheel deflector through the same protocol set-up without rebuilding the model or the checks.
- Physics model. CFD and FEA set up once, as templates: geometry clean-up, mesh, solver settings and post-processing that every later run reuses.
- Validation. Mesh and time-step studies, and comparison with tests or full-scale data, so the model's uncertainty is known before it is trusted.
- Automated runs. Scripted runs over the parameters and operating conditions that matter, on your hardware or in the cloud.
- AI surrogate. A machine-learning model trained on those runs answers in seconds and says how sure it is; low-confidence questions go back to the solver.
- Decision tool. Optimisation, trade-off charts or operating guidance, in a form your engineers and operators use every day.
- Field data. Test, trial and monitoring data flow back to recalibrate the model, so it improves with every project instead of being rebuilt.
- A parameterised front-corner model in your existing crash solver, with barrier, speed, overlap and tolerance held in a load-case file instead of in the deck.
- A post-processing script that reports the protocol's points as residual movement in its coordinate frame, with the energy, added-mass and contact checks, for every run.
- A validation record against your last physical test: measures, tolerances, results and the spread from unmeasured inputs.
- An automated run set that plans the experiments, submits to your cluster and rejects runs that fail the checks.
- A surrogate with a stated range and a gate at the step, so a request outside the range goes to the full model.
- Handover and training, so your team extends it itself. See our training and software development services.
Questions engineers ask about small overlap crash simulation
What is the small overlap crash test?
How does the oblique crash test differ from the small overlap test?
Can simulation replace the physical crash test?
How accurate does the model need to be?
What do you need from us to start?
If a front corner is holding up a release, send us the corner model or a description of it, your solver, your last small overlap or oblique report with intrusion measures and video, and the options you are weighing. We will reply with how we would set up the load case, which measures and tolerances the validation record should hold, and what a surrogate-assisted study would cover and where its range would end. Start with a conversation.